Transcription of Quantitative Data Analysis - SAGE Publications Inc
1 375 Quantitative Data AnalysisCHAPTER 13 Oh no, not data Analysis and statistics! We now hit the chapter that you may have been fearing all along, the chapter on data Analysis and the use of statistics. This chapter describes what you need to do after your data have been collected. You now need to analyze what you have found, interpret it, and decide how to present your data so that you can most clearly make the points you wish to you probably dread about this chapter is something that you either sense or know from a previous course: Studying data Analysis and statistics will lead you into that feared world of mathematics. We would like to state at the begin-ning, however, that you have relatively little to fear. The kind of mathematics required to perform the data Analysis tasks in this chapter is minimal.
2 If you can add, subtract, multiply, and divide and are willing to put some effort into carefully reading the chapter, you will do well in the statistical Analysis of your data. In fact, it is our position that the Analysis of your data will require more in the way of careful and logical thought than in mathematical skill. One helpful way to think of statistics is that LEARNING OBJECTIVES1. Identify the types of graphs and statistics that are appropriate for Analysis of variables at each level of List the guidelines for constructing frequency Discuss the advantages and disadvantages of using each of the three measures of central Understand the difference between the variance and the standard Define the concept of skewness and explain how it can influence measures of central Explain how to calculate percentages in a cross-tabulation table and how to interpret the results.
3 7. Discuss the three reasons for conducting an elaboration Write a statement based on inferential statistics that reports the confidence that can be placed in a statistical statement of a population Define the statistics obtained in a multiple regression Analysis and explain their IV After the Data Are Collected376it consists of a set of tools that you will use to examine your data to help you answer the questions that motivated your research in the first place. Right now, the toolbox that holds your statistical tools is fairly empty (or completely empty). In the course of this chapter, we will add some fundamental tools to that toolbox. We would also like to note at the beginning that the kinds of statistics you will use on criminological data are very much the same as those used by economists, psychologists, political scientists, sociologists, and other social scientists.
4 In other words, statistical tools are statistical tools, and all that changes is the nature of the problem to which those tools are chapter will introduce several common statistics in social research and highlight the factors that must be considered in using and interpreting statistics. Think of it as a review of fundamental social statistics, if you have already studied them, or as an introductory overview, if you have preliminary sections lay the foundation for studying statistics. In the first, we will discuss the role of statis-tics in the research process, returning to themes and techniques you already know. In the second preliminary sec-tion, we will outline the process of acquiring data for statistical Analysis . In the rest of the chapter, we will explain how to describe the distribution of single variables and the relationships among variables.
5 Along the way, we will address ethical issues related to data Analysis . This chapter will be successful if it encourages you to see statistics responsibly and evaluate them critically and gives you the confidence necessary to seek opportunities for extending your statistical should be noted that, in this chapter, we focus primarily on the use of statistics for descriptive purposes. Those of you looking for a more advanced discussion of statistical methods used in criminal justice and criminology should seek other textbooks ( , Bachman and Paternoster 2008). Although many colleges and universities offer social statistics in a separate course, we don t want you to think of this chapter as something that deals with a different topic than the rest of the book. Data Analysis is an integral component of research methods, and it s important that any proposal for quantita-tive research include a plan for the data Analysis that will follow data StatisticsStatistics play a key role in achieving valid research results in terms of measure-ment, causal validity, and generalizability.
6 Some statistics are useful primarily to describe the results of measuring single variables and to construct and evaluate multi-item scales. These statistics include frequency distributions, graphs, measures of central tendency and variation, and reliability tests. Other statis-tics are useful primarily in achieving causal validity, by helping us describe the association among variables and control for, or otherwise take into account, other is one technique for measuring association and control-ling other variables and is introduced in this chapter. All these statistics are called descriptive statistics because they are used to describe the distribution of and relationship among learned in Chapter 5 that it is possible to estimate the degree of confidence that can be placed in generalizations for a sample and for the population from which the sample was selected.
7 The statistics used in making these estimates are called inferential statistics, and they include confidence intervals, to which you were exposed in Chapter 5. In this chapter we will refer only brief ly to inferential statistics, but we will emphasize later in the chapter their importance for testing hypotheses involving sample distributions: Numerical display showing the number of cases, and usually the percentage of cases (the relative frequencies), corresponding to each value or group of values of a (cross-tab): A bivariate (two-variable) distribution showing the distribution of one variable for each category of another statistics: Statistics used to describe the distribution of and relationship among statistics: Mathematical tools for estimating how likely it is that a statistical result based on data from a random sample is representative of the population from which the sample is assumed to have been the edge on your studies.
8 Take a quiz to find out what you've learned. Review key terms with eFlashcards. Watch videos that enhance chapter 13 Quantitative Data Analysis377 Criminological theory and the results of prior research should guide our statistical plan or analytical strategy, as they guide the choice of other research methods. In other words, we want to use the statistical strategy that will best answer our research question. There are so many particular statistics and so many ways for them to be used in data Analysis that even the best statistician can become lost in a sea of numbers if she is not using prior research and theo-rizing to develop a coherent Analysis plan. It is also important for an analyst to choose statistics that are appropriate to the level of measurement of the variables to be analyzed.
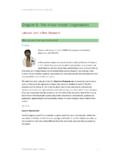
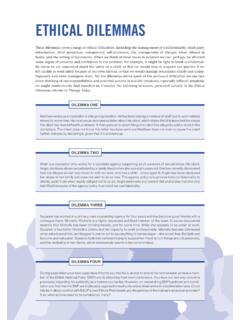
9 As you learned in Chapter 4, numbers used to represent the values of variables may not actually signify different quantities, meaning that many statistical techniques will be inapplicable. Some statistics, for example, will be appropriate only when the variable you are examining is measured at the nominal level. Other kinds of statistics will require interval-level measurement. To use the right statistic, then, you must be very familiar with the measurement properties of your variables (and you thought that stuff would go away!).Exhibit for Perceived Fear of Being Caught and DelinquencyYouth WhoPerceive TheyAre More Likelyto Get CaughtWill Be LessLikely to Engagein DelinquencyIn this chapter, we will use research on the causes of delinquency for our examples. More specifically, our data will be a subset of a much larger study of a sample of approximately 1,200 high school students selected from the metropolitan and suburban high schools of a city in South Carolina.
10 These students, all of whom were in the 10th grade, completed a questionnaire that asked about such things as how they spent their spare time; how they got along with their parents, teachers, and friends; their attitudes about delinquency; whether their friends committed delinquent acts; and their own involvement in delinquency. The original research study was designed to test specific hypotheses about the fac-tors that inf luence delinquency. It was predicted that delinquent behavior would be affected by such things as the level of supervision provided by parents, the students own moral beliefs about delinquency, their involvement in conven-tional activities such as studying and watching TV, their fear of getting caught, their friends involvement in crime, and whether these friends provided verbal support for delinquent acts.