Example: stock market
STAT 720 TIME SERIES ANALYSIS - University of South Carolina
(iid noise) The simplest time series model is the one with no trend or seasonal component, and the observations X t s are simply independent and identically distribution random
Tags:
Information
Domain:
Source:
Link to this page:
Documents from same domain

STAT 730 Chapter 3: Normal Distribution Theory
people.stat.sc.eduSTAT 730 Chapter 3: Normal Distribution Theory Timothy Hanson DepartmentofStatistics,UniversityofSouthCarolina Stat730: MultivariateAnalysis 1/36. Nice properties of multivariate normal random vectors Multivariate normal easily generalizes univariate normal. Much harder to generalize Poisson, gamma, exponential, etc. ... (Chapter 2). ...

3 Random vectors and multivariate normal distribution
people.stat.sc.edu3 Random vectors and multivariate normal distribution As we saw in Chapter 1, a natural way to think about repeated measurement data is as a series of random vectors, one vector corresponding to …
JAGS Version 4.3.0 user manual - University of South Carolina
people.stat.sc.edufrom source are given in a separate JAGS Installation manual. 1.2 Getting help The best way to get help on JAGS is to use the discussion forums hosted on Sourceforge at
JAGS Version 4.3.0 user manual - University of South Carolina
people.stat.sc.edu11 The dic module 64 11.1 Monitors in the dic module . . . . . . . . . . . . . . . . . . . . . . . . . . . . 64 11.1.1 The deviance monitor ...

Exploratory Factor Analysis - University of South Carolina
people.stat.sc.eduwell the variables load on the different factors. A factor is reliable if it has: 3 or more variables with loadings of 0.8 and any n 4 or more variables with loadings of 0.6 and any n 10 or more variables with loadings of 0.4 and n≥150 Factors with only a few loadings require n≥300

Posterior Predictive Distribution - University of South ...
people.stat.sc.eduPosterior Predictive Distribution I Recall that for a fixed value of θ, our data X follow the distribution p(X|θ). I However, the true value of θ is uncertain, so we should average over the possible values of θ to get a better idea of the distribution of X. I Before taking the sample, the uncertainty in θ is represented by the prior distribution p(θ).

Density Curves and Normal Distributions
people.stat.sc.eduSTAT 110: Chapter 13 Hitchcock This area represents the proportion of all weights (in the population) that are between 100 and 200 pounds. 100 150 200 250 0.000 0.002 0.004 0.006 0.008 0.010 Possible density curve for the weight variable Weight Density This area = 0.84
Related documents

Bias-Variance in Machine Learning - Carnegie Mellon School ...
www.cs.cmu.eduprediction is correct Noise but no variance Variance but no noise . Analysis of error: biased case Main prediction is wrong Noise and variance No noise, no variance . Analysis of error: overal l Interaction terms are usually small Hopefully we’ll be in this case more often, if we’ve

A New Approach to Linear Filtering and Prediction Problems
www.cs.unc.eduSuch problems are: (i) Prediction of random signals; (ii) separa- tion of random signals from random noise; (iii) detection of signals of known form (pulses, sinusoids) in the presence of random noise. In his pioneering work, Wiener [1]3 showed that problems (i) and (ii) lead to the so-called Wiener-Hopf integral equation; he

SLAM for Dummies - Massachusetts Institute of Technology
dspace.mit.eduThe Jacobian of the prediction model: A .....33 The SLAM specific Jacobians: J xr and J z ... The process noise: Q and W.....35 The measurement noise: R and V .....35 STEP 1: UPDATE CURRENT STATE USING THE ODOMETRY DATA ...
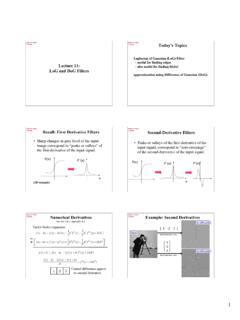
Lecture 11: LoG and DoG Filters
www.cse.psu.edu–Very noise sensitive! • It is always combined with a smoothing operation: Smooth LaplacianLaplacian I(x,y) O(x,y)O(x,y) O.Camps, PSU CSE486 Robert Collins ... •The prediction is not exact, but means that it is not necessary to store all of the next fine scale layer. •Laplacian pyramid stores the difference. 7

Unsupervised Visual Representation Learning by Context ...
www.cv-foundation.orgUnsupervised Visual Representation Learning by Context Prediction Carl Doersch1,2 Abhinav Gupta1 Alexei A. Efros2 1 School of Computer Science 2 Dept. of Electrical Engineering and Computer Science Carnegie Mellon University University of California, Berkeley Abstract This work explores the use of spatial context as a source

RADIO OPERATORS HANDBOOK - United States Marine Corps
www.trngcmd.marines.milL Frequency Prediction Means L-1 M Position and Navigation Systems M-1 NSize of Dipole and Inverted L Antennas N-1 O Field Repair and Expedients O-1 P Radio Operator’s Checklist P-1 QGlossary Q-1 RReferences and Related Publications …

Recommendation for the Entropy Sources Used for ... - NIST
nvlpubs.nist.govAuthority This publication has been developed by NIST in accordance with its statutory responsibilities under the Federal Information Security Modernization Act (FISMA) of 2014, 44 U.S.C. § 3551et seq. , Public Law (P.L.) 113- 283.