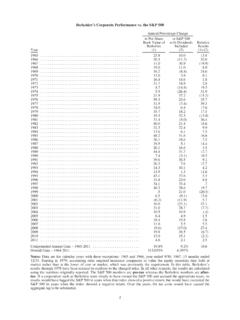
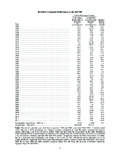
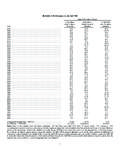
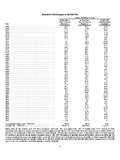
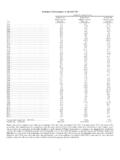
Transcription of Berkshire’s Corporate Performance vs. the S&P 500
1 Berkshire's Corporate Performance vs. the S&P 500. Annual Percentage Change in Per-Share in S&P 500. Book Value of with Dividends Relative Berkshire Included Results Year (1) (2) (1)-(2). 1965 .. 1966 .. ( ) 1967 .. ( ). 1968 .. 1969 .. ( ) 1970 .. 1971 .. 1972 .. 1973 .. ( ) 1974 .. ( ) 1975 .. ( ). 1976 .. 1977 .. ( ) 1978 .. 1979 .. 1980 .. ( ). 1981 .. ( ) 1982 .. 1983 .. 1984 .. 1985 .. 1986 .. 1987 .. 1988 .. 1989 .. 1990 .. ( ) 1991 .. 1992 .. 1993 .. 1994 .. 1995 .. 1996 .. 1997 .. 1998 .. 1999 .. ( ). 2000 .. ( ) 2001 .. ( ) ( ) 2002.
2 ( ) 2003 .. ( ). 2004 .. ( ). 2005 .. 2006 .. 2007 .. 2008 .. ( ) ( ) 2009 .. ( ). 2010 .. ( ). 2011 .. 2012 .. ( ). Compounded Annual Gain 1965- 2012 .. Overall Gain 1964- 2012 .. 586,817% 7,433%. Notes: Data are for calendar years with these exceptions: 1965 and 1966, year ended 9/30; 1967, 15 months ended 12/31. Starting in 1979, accounting rules required insurance companies to value the equity securities they hold at market rather than at the lower of cost or market, which was previously the requirement. In this table, Berkshire's results through 1978 have been restated to conform to the changed rules.
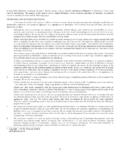
3 In all other respects, the results are calculated using the numbers originally reported. The S&P 500 numbers are pre-tax whereas the Berkshire numbers are after- tax. If a corporation such as Berkshire were simply to have owned the S&P 500 and accrued the appropriate taxes, its results would have lagged the S&P 500 in years when that index showed a positive return, but would have exceeded the S&P 500 in years when the index showed a negative return. Over the years, the tax costs would have caused the aggregate lag to be substantial. 2.
4 BERKSHIRE HATHAWAY INC. To the Shareholders of Berkshire Hathaway Inc.: In 2012 , Berkshire achieved a total gain for its shareholders of $ billion. We used $ billion of that to repurchase our stock, which left us with an increase in net worth of $ billion for the year. The per-share book value of both our Class A and Class B stock increased by Over the last 48 years (that is, since present management took over), book value has grown from $19 to $114,214, a rate of compounded annually.*. A number of good things happened at Berkshire last year, but let's first get the bad news out of the way.
5 When the partnership I ran took control of Berkshire in 1965, I could never have dreamed that a year in which we had a gain of $ billion would be subpar, in terms of the comparison we present on the facing page. But subpar it was. For the ninth time in 48 years, Berkshire's percentage increase in book value was less than the S&P's percentage gain (a calculation that includes dividends as well as price appreciation). In eight of those nine years, it should be noted, the S&P had a gain of 15% or more. We do better when the wind is in our face.
6 To date, we've never had a five-year period of underperformance, having managed 43 times to surpass the S&P over such a stretch. (The record is on page 103.) But the S&P has now had gains in each of the last four years, outpacing us over that period. If the market continues to advance in 2013, our streak of five- year wins will end. One thing of which you can be certain: Whatever Berkshire's results, my partner Charlie Munger, the company's Vice Chairman, and I will not change yardsticks. It's our job to increase intrinsic business value for which we use book value as a significantly understated proxy at a faster rate than the market gains of the S&P.
7 If we do so, Berkshire's share price, though unpredictable from year to year, will itself outpace the S&P over time. If we fail, however, our management will bring no value to our investors, who themselves can earn S&P returns by buying a low-cost index fund. Charlie and I believe the gain in Berkshire's intrinsic value will over time likely surpass the S&P returns by a small margin. We're confident of that because we have some outstanding businesses, a cadre of terrific operating managers and a shareholder-oriented culture. Our relative Performance , however, is almost certain to be better when the market is down or flat.
8 In years when the market is particularly strong, expect us to fall short. The second disappointment in 2012 was my inability to make a major acquisition. I pursued a couple of elephants, but came up empty-handed. * All per-share figures used in this report apply to Berkshire's A shares. Figures for the B shares are 1/1500th of those shown for A. 3. Our luck, however, changed early this year. In February, we agreed to buy 50% of a holding company that will own all of H. J. Heinz. The other half will be owned by a small group of investors led by Jorge Paulo Lemann, a renowned Brazilian businessman and philanthropist.
9 We couldn't be in better company. Jorge Paulo is a long-time friend of mine and an extraordinary manager. His group and Berkshire will each contribute about $4 billion for common equity in the holding company. Berkshire will also invest $8 billion in preferred shares that pay a 9% dividend. The preferred has two other features that materially increase its value: at some point it will be redeemed at a significant premium price and the preferred also comes with warrants permitting us to buy 5% of the holding company's common stock for a nominal sum.
10 Our total investment of about $12 billion soaks up much of what Berkshire earned last year. But we still have plenty of cash and are generating more at a good clip. So it's back to work; Charlie and I have again donned our safari outfits and resumed our search for elephants. Now to some good news from 2012 : Last year I told you that BNSF, Iscar, Lubrizol, Marmon Group and MidAmerican Energy our five most profitable non-insurance companies were likely to earn more than $10 billion pre-tax in 2012 . They delivered. Despite tepid growth and weakening economies throughout much of the world, our powerhouse five had aggregate earnings of $ billion, about $600 million more than in 2011.