Transcription of 1. ELECTRICAL SYSTEM
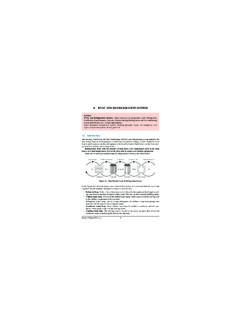
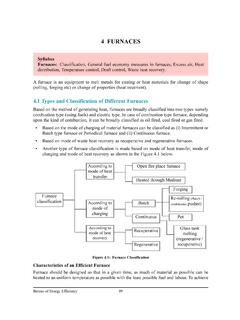
1 1. ELECTRICAL SYSTEM1 Bureau of Energy EfficiencySyllabusElectrical SYSTEM :Electricity billing, ELECTRICAL load management and maximum demandcontrol, Power factor improvement and its benefit, Selection and location of capacitors,Performance assessment of PF capacitors, Distribution and transformer Introduction to Electric Power Supply SystemsElectric power supply SYSTEM in a country comprises of generating units that produce electric-ity; high voltage transmission lines that transport electricity over long distances; distributionlines that deliver the electricity to consumers; substations that connect the pieces to each other;and energy control centers to coordinate the operation of the components. The Figure shows a simple electric supply SYSTEM with transmission and distributionnetwork and linkages from electricity sources to Typical Electric Power Supply SystemsPower Generation PlantThe fossil fuels such as coal, oil and natural gas, nuclear energy, and falling water (hydel) arecommonly used energy sources in the power generating plant.
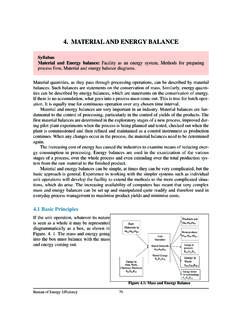
2 A wide and growing variety ofunconventional generation technologies and fuels have also been developed, including cogen-eration, solar energy, wind generators, and waste materials. About 70 % of power generating capacity in India is from coal based thermal power principle of coal-fired power generation plant is shown in Figure Energy stored in the1. ELECTRICAL System2 Bureau of Energy Efficiencycoal is converted in to electricity in thermal power plant. Coal is pulverized to the consistencyof talcum powder. Then powdered coal is blown into the water wall boiler where it is burned attemperature higher than 1300 C. The heat in the combustion gas is transferred into steam. Thishigh-pressure steam is used to run the steam turbine to spin. Finally turbine rotates the genera-tor to produce electricity.
3 Figure Principle of Thermal Power GenerationIn India, for the coal based power plants, the overall efficiency ranges from 28% to 35%depending upon the size, operational practices and capacity utilization. Where fuels are thesource of generation, a common term used is the HEAT RATE which reflects the efficiencyof generation. HEAT RATE is the heat input in kilo Calories or kilo Joules, for generating one kilo Watt-hour of ELECTRICAL output. One kilo Watt hour of ELECTRICAL energy being equiv-alent to 860 kilo Calories of thermal energy or 3600 kilo Joules of thermal energy. The HEATRATE expresses in inverse the efficiency of power and Distribution Lines The power plants typically produce 50 cycle/second(Hertz), alternating-current (AC) electricity with volt-ages between 11kV and 33kV.
4 At the power plant site,the 3-phase voltage is stepped up to a higher voltage fortransmission on cables strung on cross-country voltage (HV) and extra high voltage (EHV)transmission is the next stage from power plant totransport power over long distances at voltageslike; 220 kv & 400 kV. Where transmission is over1000 kM, high voltage direct current transmission isalso favoured to minimize the losses. Sub-transmission network at 132 kV, 110 kV, 66 kVor 33 kV constitutes the next link towards the end at 11 kV / kV / kV constitutes thelast link to the consumer, who is connected directly orthrough transformers depending upon the drawl level of1. ELECTRICAL System3 Bureau of Energy Efficiencyservice. The transmission and distribution network include sub-stations, lines and distributiontransformers.
5 High voltage transmission is used so that smaller, more economical wire sizes canbe employed to carry the lower current and to reduce losses. Sub-stations, containing step-downtransformers, reduce the voltage for distribution to industrial users. The voltage is furtherreduced for commercial facilities. Electricity must be generated, as and when it is needed sinceelectricity cannot be stored virtually in the is no difference between a transmission line and a distribution line except for the volt-age level and power handling capability. Transmission lines are usually capable of transmittinglarge quantities of electric energy over great distances. They operate at high lines carry limited quantities of power over shorter drops in line are in relation to the resistance and reactance of line, length and thecurrent drawn.
6 For the same quantity of power handled, lower the voltage, higher the currentdrawn and higher the voltage drop. The current drawn is inversely proportional to the voltagelevel for the same quantity of power handled. The power loss in line is proportional to resistance and square of current. ( PLOSS=I2R).Higher voltage transmission and distribution thus would help to minimize line voltage drop inthe ratio of voltages, and the line power loss in the ratio of square of voltages. For instance, ifdistribution of power is raised from 11 kV to 33 kV, the voltage drop would be lower by a fac-tor 1/3 and the line loss would be lower by a factor (1/3) , 1/9. Lower voltage transmissionand distribution also calls for bigger size conductor on account of current handling capacityneeded.
7 Cascade Efficiency The primary function of transmission and distribution equipment is to transfer power econom-ically and reliably from one location to another. Conductors in the form of wires and cables strung on towers and poles carry the high-volt-age, AC electric current. A large number of copper or aluminum conductors are used to formthe transmission path. The resistance of the long-distance transmission conductors is to be min-imized. Energy loss in transmission lines is wasted in the form of I2R are used to correct power factor by causing the current to lead the voltage. Whenthe AC currents are kept in phase with the voltage, operating efficiency of the SYSTEM is main-tained at a high devices are switches, relays, circuit breakers, and fuses. Each of thesedevices is designed to carry and interrupt certain levels of current.
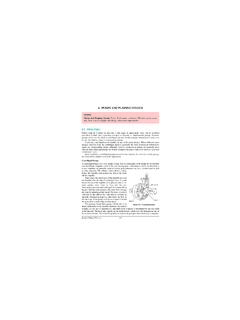
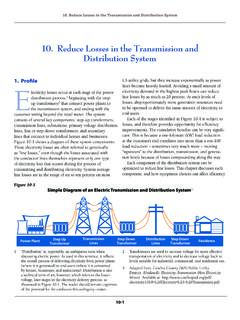
8 Making and breaking the cur-rent carrying conductors in the transmission path with a minimum of arcing is one of the mostimportant characteristics of this device. Relays sense abnormal voltages, currents, and frequen-cy and operate to protect the SYSTEM . Transformers are placed at strategic locations throughout the SYSTEM to minimize powerlosses in the T&D SYSTEM . They are used to change the voltage level from low-to-high in step-up transformers and from high-to-low in step-down units. The power source to end user energy efficiency link is a key factor, which influences theenergy input at the source of supply. If we consider the electricity flow from generation to theuser in terms of cascade energy efficiency, typical cascade efficiency profile from generation to11 33 kV user industry will be as below:1.
9 ELECTRICAL System4 Bureau of Energy EfficiencyGenerationEfficiency 1 Step-up Station 2 EHVT ransmission &Station 3 HVTransmission &Station 4 Sub-transmission 5 PrimaryDistribution 7 DistributionStation 6 End userPremisesThe cascade efficiency in the T&D SYSTEM from output of the power plant to the end use is87% ( x x x x x = 87%)Industrial End UserAt the industrial end user premises, again the plant network elements like transformers atreceiving sub-station, switchgear, lines and cables, load-break switches, capacitors cause loss-es, which affect the input-received energy. However the losses in such systems are meager typical plant single line diagram of ELECTRICAL distribution SYSTEM is shown in Figure ranges 28 35 % with respect to size of thermal plant,age of plant and capacity utilisationStep-up to 400 / 800 kV to enable EHV transmissionEnvisaged max.
10 Losses % or efficiency of %EHV transmission and substations at 400 kV / 800 maximum losses % or efficiency of 99 %HV transmission & Substations for 220 / 400 maximum losses % or efficiency of %Sub-transmission at 66 / 132 kVEnvisaged maximum losses 4 % or efficiency of 96 %Step-down to a level of 11 / 33 losses % or efficiency of %Distribution is final link to end user at 11 / 33 losses maximum 5 % of efficiency of 95 %Cascade efficiency from Generation to end user= 1x 2x 3x 4x 5x 6x 7 1. ELECTRICAL System5 Bureau of Energy EfficiencyONE Unit saved = TWO Units GeneratedAfter power generation at the plant it is transmitted and distributed over a wide standard technical losses are around 17 % in India (Efficiency = 83%). But the figures formany of the states show T & D losses ranging from 17 50 %.