Transcription of BEE701 POWER SYSTEM ANALYSIS
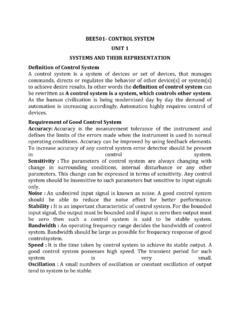
1 BEE701 POWER SYSTEM ANALYSIS UNIT I POWER SYSTEM COMPONENTS POWER SYSTEM ANALYSIS The evaluation of POWER SYSTEM is called as POWER SYSTEM ANALYSIS Functions of POWER SYSTEM ANALYSIS To monitor the voltage at various buses, real and reactive POWER flow between buses. To design the circuit breakers. To plan future expansion of the existing SYSTEM To analyze the SYSTEM under different fault conditions To study the ability of the SYSTEM for small and large disturbances (Stability studies) COMPONENTS OF A POWER SYSTEM transformer lines transformer transformer SINGLE line DIAGRAM A single line diagram is diagrammatic representation of POWER SYSTEM in which the components are represented by their symbols and interconnection between them are shown by a straight line9eventhough the SYSTEM is three phase ratings and the impedances of the components are also marked on the single line diagram.
2 Purpose of using single line diagram The purpose of the single line diagram is to supply in concise form of the significant information about the SYSTEM . Per unit value. The per unit value of any quantity is defined as the ratio of the actual value of the any quantity to the base value of the same quantity as a decimal. per unit=actual value/base value Need for base values The components or various sections of POWER SYSTEM may operate at different voltage and POWER levels. It will be convenient for ANALYSIS of POWER SYSTEM if the voltage, POWER , current and impedance rating of components of POWER SYSTEM are expressed with reference to a common value called base value. Advantages of per unit SYSTEM i. Per unit data representation yields valuable relative magnitude information. ii. Circuit ANALYSIS of systems containing transformers of various transformation ratios is greatly simplified.
3 Iii. The systems are ideal for the computerized ANALYSIS and simulation of complex POWER SYSTEM problems. iv. Manufacturers usually specify the impedance values of equivalent in per unit of the equipments rating. If the any data is not available, it is easier to assume its per unit value than its numerical value. v. The ohmic values of impedances are refereed to secondary is different from the value as referee to primary. However, if base values are selected properly, the impedance is the same on the two sides of the transformer. vi. The circuit laws are valid in systems, and the POWER and voltages equations are simplified since the factors of 3 and 3 are eliminated. Change the base impedance from one set of base values to another set Let Z=Actual impedance , Zb=Base impedance , Per unit impedance of a circuit element= = 2 = 2 (1) The eqn 1 show that the per unit impedance is directly proportional to base megavoltampere and inversely proportional to the square of the base voltage.
4 Using Eqn 1 we can derive an expression to convert the impedance expressed in one base value ( old base) to another base (new base) Let kVb,oldand MVAb,old represents old base values and kVb,newand MVA b ,new represent new base value Let ,old= impedance of a circuit element calculated on old base ,new= impedance of a circuit element calculated on new base If old base values are used to compute the of a circuit element ,with impedance Z then eqn 1 can be written as . , = , , 2 = . , , 2 , (2) If the new base values are used to compute impedance of a circuit element with impedance Z, then eqn 1 can be written as . , = , , 2 (3) On substituting for Z from eqn 2 in eqn 3 we get . , = .. , 2 , , , 2 . , = , , , 2 , , (4) The eqn 4 is used to convert the expressed on one base value to another base MODELLING OF GENERATOR AND SYNCHRONOUS MOTOR 1 equivalent circuit of generator 1 equivalent circuit of synchronous motor MODELLING OF TRANSFORMER MODELLING OF TRANSMISSION line T type type MODELLING OF INDUCTION MOTOR Impedance diagram & approximations made in impedance diagram The impedance diagram is the equivalent circuit of POWER SYSTEM in which the various components of POWER SYSTEM are represented by their approximate or simplified equivalent circuits.
5 The impedance diagram is used for load flow studies. Approximation: (i) The neutral reactances are neglected. (ii) The shunt branches in equivalent circuit of transformers are neglected. Reactance diagram & approximations made in reactance diagram The reactance diagram is the simplified equivalent circuit of POWER SYSTEM in which the various components of POWER SYSTEM are represented by their reactances. The reactance diagram can be obtained from impedance diagram if all the resistive components are neglected. The reactance diagram is used for fault calculations. Approximation: (i) The neutral reactances are neglected. (ii) The shunt branches in equivalent circuit of transformers are neglected. (iii) The resistances are neglected. (iv) All static loads are neglected. (v) The capacitance of transmission lines are neglected. PROCEDURE TO FORM REACTANCE DIAGRAM FROM SINGLE line DIAGRAM a base POWER kVAb or MVAb a base voltage kVb 3.
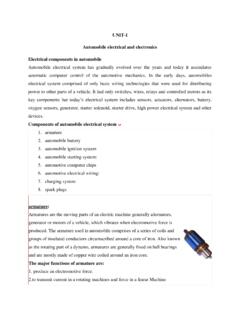
6 The voltage conversion is achieved by means of transformer kVb on LT section= kVb on HT section x LT voltage rating/HT voltage rating 4. When specified reactance of a component is in ohms reactance=actual reactance/base reactance specified reactance of a component is in EXAMPLE 1. The single line diagram of an unloaded POWER SYSTEM is shown in Fig generator transformer ratings are as follows. G1=20 MVA, 11 kV, X =25% G2=30 MVA, 18 kV, X =25% G3=30 MVA, 20 kV, X =21% T1=25 MVA, 220 kV ( /Y), X=15% T2=3 single phase units each rated 10 MVA, 127/18 kV(Y/ ), X=15% T3=15 MVA, 220/20 kV(Y/ ), X=15% Draw the reactance diagram using a base of 50 MVA and 11 kV on the generator1. Fig 1 SOLUTION Base megavoltampere,MVAb,new=50 MVA Base kilovolt kVb,new=11 kV ( generator side)
7 FORMULA The new reactance , = , , , 2 , , Reactance of Generator G kVb,old=11 kV kVb,new=11 kV MVAb,old= 20 MVA MVAb,new=50 MVA ,old= The new reactance of Generator G= , , , 2 , , = 1111 2 5020 = Reactance of Transformer T1 kVb,old=11 kV kVb,new=11 kV MVAb,old= 25 MVA MVAb,new=50 MVA ,old= The new reactance of Transformer T1= , , , 2 , , = 1111 2 5025 = Reactance of Transmission line It is connected to the HT side of the Transformer T1 Base kV on HT side of transformer T 1 = =11 22011=220 Actual Impedance X actual= 100ohm Base impedance X base= , 2 , =220250=968 reactance of 100 transmission line = , , =100968=.
8 Reactance of 150 transmission line = , , =150968= . Reactance of Transformer T2 kVb,old=127 * 3 kV =220 kV kVb,new=220 kV MVAb,old= 10 * 3=30 MVA MVAb,new=50 MVA ,old= The new reactance of Transformer T2= , , , 2 , , = 220220 2 5030 = Reactance of Generator G2 It is connected to the LT side of the Transformer T2 Base kV on LT side of transformer T 2 = =220 18220=18 kVb,old=18 kV kVb,new=18 kV MVAb,old= 30 MVA MVAb,new=50 MVA ,old= The new reactance of Generator G 2= , , , 2 , , = 1818 2 5030 = Reactance of Transformer T3 kVb,old=20 kV kVb,new=20 kV MVAb,old= 20 MVA MVAb,new=50 MVA ,old= The new reactance of Transformer T3= , , , 2.
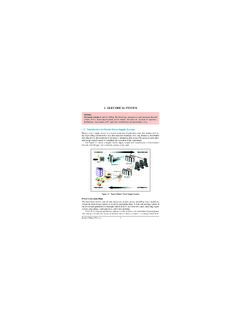
9 = 2020 2 5030 = Reactance of Generator G3 It is connected to the LT side of the Transformer T3 Base kV on LT side of transformer T 3 = =220 20220=20 kVb,old=20 kV kVb,new=20 kV MVAb,old= 30 MVA MVAb,new=50 MVA ,old= The new reactance of Generator G 3= , , , 2 , , = 2020 2 5030 = 2) Draw the reactance diagram for the POWER SYSTEM shown in fig 4 .Use a base of 50 MVA 230 kV in 30 line . The ratings of the generator, motor and transformers are Generator = 20 MVA, 20 kV, X=20% Motor = 35 MVA, kV, X=25% T1 = 25 MVA, 18/230 kV (Y/Y), X=10% T2 = 45 MVA, 230 kV (Y/ ), X=15% Fig 4 Solution Base megavoltampere,MVAb,new=50 MVA Base kilovolt kVb,new=230 kV ( Transmission line side) FORMULA The new reactance , = , , , 2 , , Reactance of Generator G It is connected to the LT side of the T1 transformer Base kV on LT side of transformer T 1 = =230 18230=18 kVb,old=20 kV kVb,new=18 kV MVAb,old= 20 MVA MVAb,new=50 MVA ,old= The new reactance of Generator G= , , , 2 , , = 2018 2 5020 = Reactance of Transformer T1 kVb,old=18 kV kVb,new=18 kV MVAb,old= 25 MVA MVAb,new=50 MVA ,old= The new reactance of Transformer T1= , , , 2 , , = 1818 2 5025 = Reactance of Transmission line It is connected to the HT side of the Transformer T1 Actual Impedance X actual= j30 ohm Base impedance X base= , 2.
10 =230250=1058 reactance of j30 transmission line = , , = 301058= . Reactance of Transformer T2 kVb,old=230 kV kVb,new=230 kV MVAb,old= 45 MVA MVAb,new=50 MVA ,old= The new reactance of Transformer T2= , , , 2 , , = 230230 2 5045 = Reactance of Motor M2 It is connected to the LT side of the Transformer T2 Base kV on LT side of transformer T 2 = =230 kVb,old= kV kVb,new= kV MVAb,old= 35 MVA MVAb,new=50 MVA ,old= The new reactance of Generator G 2= , , , 2 , , = 2 5035 = BUS The meeting point of various components in a POWER SYSTEM is called a bus. The bus is a conductor made of copper or aluminum having negligible resistance.