Transcription of 2.2.32. LOSS ON DRYING - 药物在线-快捷药物信息 …
1 EUROPEAN PHARMACOPOEIA Loss on dryingTable Preparation of stacking gelComponent volumes (mL) per gel mould volume ofSolution components1mL2mL3mL4mL5mL6mL8mL10 mLWater solution(1) M Tris (pH )(2) g/L SDS(3) g/L APS(4) (5) (1) Acrylamide solution:30 per cent acrylamide/bisacrylamide (29:1) solution R.(2) M Tris (pH ):1 M tris-hydrochloride buffer solution pH R.(3) 100 g/L SDS: a 100 g/L solution ofsodium dodecyl sulfate R.(4) 100 g/L APS: a 100 g/L solution ofammonium persulfate R. Ammonium persulfate provides the free radicals that drive polymerisation ofacrylamide and bisacrylamide. Since ammonium persulfate solution decomposes slowly, fresh solutions must be prepared weekly.
2 (5) TEMED:tetramethylethylenediamine Rfor at least 2 h (overnight incubation is possible).For silver staining, add to the final rinsing a step of 5 min in a20 g/L solution ofglycerol two sheets of porous cellulose film inwater Randincubate for 5 min to 10 min. Place one of the sheets on adrying frame. Carefully lift the gel and place it on the cellulosefilm. Remove any trapped air bubbles and pour a few millilitresofwater Raround the edges of the gel. Place the second sheeton top and remove any trapped air bubbles. Complete theassembly of the DRYING frame. Place in an oven or leave at roomtemperature until DETERMINATIONM olecular masses of proteins are determined by comparison oftheir mobilities with those of several marker proteins of knownmolecular weight.
3 Mixtures of proteins with precisely knownmolecular masses blended for uniform staining are availablefor calibrating gels. They are obtainable in various molecularmass ranges. Concentrated stock solutions of proteins of knownmolecular mass are diluted in the appropriate sample buffer andloaded on the same gel as the protein sample to be after the gel has been run, the position of thebromophenol blue tracking dye is marked to identify the leadingedge of the electrophoretic ion front. This can be done bycutting notches in the edges of the gel or by inserting a needlesoaked in India ink into the gel at the dye front. After staining,measure the migration distances of each protein band (markersand unknowns) from the top of the resolving gel.
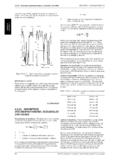
4 Divide themigration distance of each protein by the distance travelledby the tracking dye. The normalised migration distances soobtained are called the relative mobilities of the proteins(relative to the dye front) and conventionally denoted a plot of the logarithm of the relative molecularmasses (Mr)oftheproteinstandardsasafunctionofth eRFvalues. Note that the graphs are slightly sigmoid. Unknownmolecular masses can be estimated by linear regression analysisor interpolation from the curves of logMragainstRFas long asthe values obtained for the unknown samples are positionedalong the linear part of the OF THE TESTThe test is not valid unless the proteins of the molecular massmarker are distributed along 80 per cent of the length of thegel andover the required separation range ( the rangecovering the product and its dimer or the product and its relatedimpurities) the separation obtained for the relevant proteinbands shows a linear relationship between the logarithm of themolecular mass and theRF.
5 Additional validation requirementswith respect to the solution under test may be specified inindividual OF IMPURITIESW here the impurity limit is specified in the individualmonograph, a reference solution corresponding to that levelof impurity should be prepared by diluting the test example, where the limit is 5 per cent, a reference solutionwould be a 1:20 dilution of the test solution. No impurity(any band other than the main band) in the electropherogramobtained with the test solution may be more intense than themain band obtained with the reference validated conditions impurities may be quantifiedby normalisation to the main band using an integratingdensitometer.
6 In this case, the responses must be validated LOSS ON DRYINGLoss on DRYING is the loss of mass expressed as per Place the prescribed quantity of the substance tobe examined in a weighing bottle previously dried under theconditions prescribed for the substance to be examined. Dry thesubstance to constant mass or for the prescribed time by oneof the following procedures. Where the DRYING temperature isindicated by a single value rather than a range, DRYING is carriedout at the prescribed temperature 2 ) in a desiccator : the DRYING is carried out overdiphosphoruspentoxide Rat atmospheric pressure and at roomtemperature;b) in vacuo : the DRYING is carried out overdiphosphoruspentoxide R, at a pressure of kPa to kPa at roomtemperature;c) in vacuowithin a specified temperature range : the DRYING iscarried out overdiphosphorus pentoxide R, kPa to kPa within the temperature range prescribedin the monograph.
7 D) inanovenwithinaspecifiedtemperaturerange :thedryingis carried out in an oven within the temperature rangeprescribed in the monograph;e) under high vacuum : the DRYING is carried out overdiphosphorus pentoxide Rat a pressure not kPa, at the temperature prescribed in the other conditions are prescribed, the procedure to be used Notices (1) apply to all monographs and other Nuclear magnetic resonance spectrometryEUROPEAN PHARMACOPOEIA NUCLEAR MAGNETICRESONANCE SPECTROMETRYINTRODUCTIONN uclear magnetic resonance (NMR) spectrometry is an analyticalmethod in particular suitable for the elucidation of the chemicalstructure of organic molecules by means of interpretation oftheir NMR spectra, arising from, for example,1H or the X-nuclei13C,19F,15N,31P.
8 The spectra can be used for qualitative andquantitative suitable experimental conditions, the integrated NMRintensities of the signals are directly proportional to the numberof nuclear spins of the molecular group responsible for thesignal. These integrals can be used for quantitative PRINCIPLESP lacing an ensemble of nuclei with angular momentum anda magnetic moment in a static magnetic field (B0)causesthenuclei to arrange themselves in different, quantum-mechanicallycontrolled orientations in relation to the axis of the magneticfield. These orientations are different in energy. An oscillatinghigh-frequency magnetic field (B1), perpendicular toB0,willcause transitions between these orientations with net energyabsorption.
9 According to the resonance condition 0= B0( =gyromagneticratio, 0= Larmor frequency), either theB0magnetic field or the frequency ( 1)oftheB1field may bevaried to achieve a spectrum (continuous wave (CW) method).Nowadays theB1irradiation is achieved by the use of aradiofrequency (RF) pulse (Fourier transform (FT) method).The coherent radiation emitted during the return to the initialstate is observed in the form of a decay curve, called the freeinduction decay (FID). Subsequent Fourier transformation givesthe spectrum in the frequency domain, providing informationabout the molecular structure. Additional radiofrequency fieldsmay be applied during acquisition of the FID signal to suppressscalar (through-bond) interactions between nuclei (called decoupling ).
10 One- and multi-dimensional techniques can beapplied for qualitative and quantitative purposes, on samples ineither the liquid or the solid structural information is derived from the followingspectroscopic features: resonance frequencykind of nuclei observednumber of resonance signals (singlets,multiplets)number of chemically distinct groupsof nucleichemical shift (ppm)chemical nature and environment ofthe structural group observedintensity of resonance signalsrelative number of resonant nuclei perchemically distinct groupmultiplicity of coupling patternnumber of nuclei that are scalarcoupled to the observed nucleuscoupling constantnJ(Hz)number of bonds in the couplingpathway, and its geometryCorrelations of different spectral parameters ( chemicalshift and coupling constant, or chemical shifts of differentnuclei within one molecular system)