Transcription of 2. The costs of natural disasters
1 17 Building our Nation s Resilience to natural disasters June 2013 Australia is exposed to both frequent and large natural disasters that have the potential to destroy private property and essential infrastructure, causing problems for government, businesses and communities. Even without factoring in any findings from climate change research, there is clear evidence that the costs of natural disasters have risen materially over time. It is likely, therefore, that the forecast costs presented here are Historic economic costs of natural disastersThe costs of natural disasters throughout Australian history are substantial. Between 2000 and 2012 alone, the insured losses (borne by insurers) totalled $ billion, an average of over $ billion per year. These costs vary significantly from year to year. Chart illustrates the movements in total annual insured costs due to natural disasters from 1980 to 2012.
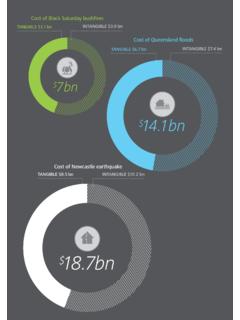
2 There are three major peaks in 1989, 1999 and 2011. These years mark some of the worst natural disasters in Australia s recent history, although there have been other years with similarly large costs (such as 1974). Table presents a costing of the extreme events that occurred in these years, and provides some indication of the growth in insured losses over time. In 1989, Newcastle was struck by a magnitude earthquake. It took the lives of 13 people and caused extensive damage to property and infrastructure In April 1999, an intense hailstorm hit the eastern and inner suburbs of Sydney, damaging properties, vehicles and aircraft Of the last 30 years, 2011 was the most costly in terms of real annual insured losses due to the Queensland floods and Tropical Cyclone Yasi. 2. The costs of natural disasterskey Points Without action, the forecast annual cost in real terms of natural disasters (across government, business and communities) in Australia is expected to reach $23 billion by 2050 Despite the significant impact this will have on Australian Government relief and recovery payments, the forward estimates of the Federal Budget make no allowance for expected natural disaster expenditure Full consideration needs to be given to the virtuous budget impact of outlays on disaster resilience funding prioritised for pre- disaster mitigation activities now will reduce public money spent on post- disaster recovery in the future The future cost of natural disaster relief and recovery could be reduced by 50% by $b (real, 2011)Source: Insurance Council of Australia (2013)Chart.
3 Insured costs of natural disasters , 1980 201218 Insured losses represent only a proportion of the total economic costs of natural disasters . Total economic costs incorporate broader social losses related to uninsured property and infrastructure, emergency response and intangible costs such as death, injury, relocation and stress. As total economic costs are borne by many parties (including individuals, communities, businesses, all levels of government and insurers), they can be difficult to measure. Research conducted by the Bureau of Transport Economics (BTE) in 2001 attempted to estimate the total economic costs borne by Australians due to natural disasters . Using data from disaster events which occurred between 1967 and 1999, and restricting the analysis to cases where the total estimated cost exceeded $10 million, it was found that total economic costs were between two and five times greater than insured costs alone for most natural is, however, important to realise that the total costs of rare but extremely severe incidents can be much greater than these annual averages.
4 There is indication of an increase in economic costs over time, particularly since 2005. This trend in natural disaster costs is largely attributable to demographic and environmental factors (Risk Frontiers, 2011). In particular, the size and density of Australia s major cities has increased, due to a combination of population growth, and domestic and international migration. Critically, significant net migration has been recorded in northerly, coastal and city fringe disaster prone regions (Department of Immigration and Citizenship, 2011). This pattern of migration has seen an increase in population density, supporting infrastructure and increasing value of assets in these areas. In addition, strong economic growth has led to the accumulation of higher value assets, increasing the economic risks posed by natural disasters . Combined, these factors have seen an increase in the exposure of Australia s economy to natural disaster risks and an increase in the costs of these disasters when they occur.
5 Forecasts of disaster costs in AustraliaUsing data on the incidence of past natural disasters in Australia (ICA, 2013), forecasts have been developed of the likely future costs of natural disasters . The process undertaken to generate these forecasts is described in Appendix forecasts presented capture three separate measures of expense: insured costs , total economic costs , and costs incurred by governments. As described earlier, insured costs represent the payouts made by insurance companies in response to eligible policy claims. To these costs must be added broader social costs which would not otherwise have been incurred had a disaster not taken place. The final additional costs relate to the likely financial obligations of local, state and federal Governments. 198919992011 Melbourne Floods and Storm$74 South East Queensland Floods and Storm$7 Queensland Floods$2,388 Cyclone Aivu$138 Cyclone Rona$14 Victorian Floods$126 Ballarat Hailstorm$81 Moora Floods$12 Cyclone Yasi$1,412 Newcastle Earthquake$3,240 Cyclone Vance$108 Melbourne Storms$488 Sydney Hailstorm$4,296 Perth Bushfires$35 Wollongong Floods and Storm$11 Margaret River Bushfires$53 Sydney Storm$89 Melbourne Storms$729 Victorian Floods and Storm$23 All Events$3,533 All Events$4,560 All Events$5,231 Table : Real insured costs of extreme disaster events ($m, 2011 prices)Source: Insurance Council of Australia (2013)19 Building our Nation s Resilience to natural disasters June 20134 These forecasts do not factor in any potential increased risk resulting from climate change.
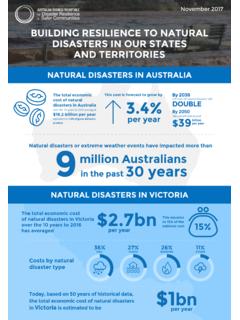
6 More detail on the modelling approach is provided in Appendix present, the total economic costs of natural disasters in Australia are estimated to average around $ billion per year4. In real terms, this total is forecast to grow by annually. This is primarily due to the likely impact of further population growth, concentrated infrastructure density, and the effect of internal migration to particularly vulnerable regions. With this growth rate, the annual total economic cost of natural disasters in Australia is expected to double by 2030 and reach $23 billion in real terms by 2050 (Chart ). Post- disaster relief and recovery expenditureRelief and recovery financial assistance programs assist individuals and communities recover from a natural disaster and are an important aspect of disaster management. In recent years there has been a rising trend in disaster recovery expenditure by all levels of government against the increased intensity of events and corresponding number of people affected.
7 A range of on-the-ground relief and recovery programs put in place after disasters have developed over time. Currently a cost-sharing approach exists between the jurisdictions and the Australian Government to help manage individual and community recovery costs following large natural disasters . natural disaster Relief and Recovery Arrangements and other paymentsThe State/Territories and Australian Government s cost-sharing system is largely composed of the natural disaster Relief and Recovery Arrangements (NDRRA). The NDRRA is a framework for the Australian Government to provide financial assistance to the states in the aftermath of natural disasters and it sets out the levels and conditions for this funding to be provided. The NDRRA consists of: Assistance to individuals in the form of Personal Hardship and Distress payments (PHD) Assistance to communities, in the form of reimbursement of 50% to 75% of State and Territory expenditure on measures such as restoration or replacement of essential public infrastructure and concessional interest rate loans to small businesses, primary producers, voluntary non-profit bodies and needy individuals.
8 The Australian Government disaster Recovery Payment (AGDRP) is a one-off payment to Australian residents affected by a major disaster in Australia or overseas. Ex-gratia payments provide one-off financial assistance to those adversely affected by a major disaster to help meet their basic, immediate : Forecast total economic cost of natural disasters : 2011 $bn (2011 prices)Source: Deloitte Access Economics (2013)20 Payments of almost $67 million in 2011 12 were made under the AGDRP and ex-gratia programs. A majority of this was from the AGDRP program for floods in New South Wales, Victoria and Queensland in early 2012. disaster Income Recovery Subsidy (DIRS) assists employees, small businesses and farmers who can demonstrate a loss as a result of a natural disaster . Implications for the Australian Government BudgetThe cost implications for the Australian Government of the recent natural disasters in Australia are set out in Table This table presents the cash payments to be made to the States in relation to past disasters under the National disaster Relief and Recovery Arrangements (NDRRA).
9 These figures are drawn from the 2013 14 Budget. While the payment of $ million due to be made in the current financial year alone seems significant, this is only a proportion of the $3 billion payment made in 2011 12, and the payments of over $2 billion to be made in 2013 14 and 2014 15. These forward estimates do not make a clear allowance for the costs of potential future natural disaster payments, and are simply defined as the present value of expected future payments. It is likely, these expected future payments are based on liabilities due from the ongoing recovery of past disasters and do not account for costs related to future events. There is an opportunity to minimise future expenses by proactively developing best-practice resilience on historical averages, total annual costs to governments of natural disasters are expected to be around $700 million per year in real terms.
10 This estimate is derived from the natural disaster costs estimated above and an assessment of historical data. Historical data indicates that the Australian and state governments collectively face around 11% of the total economic costs of natural disasters . It is estimated that 80% of this government expenditure is outlaid by the Australian Government. Considering the increase in natural disaster costs forecast over the period to 2050, it is anticipated that governments will eventually face an annual cost of around $ billion in real terms (up from $700 million). The projected trend over time is shown in Chart This analysis of government outlays is based solely on expenditure which falls under the NDRRA. Essentially, it encompasses most core natural disaster response programs from all levels of government, including emergency response, personal hardship support and reconstruction of infrastructure.