Transcription of 2014-15 HIGH SCHOOL ATHLETICS PARTICIPATION …
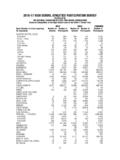
1 2014-15 high SCHOOL ATHLETICS PARTICIPATION SURVEY. Conducted By THE NATIONAL FEDERATION OF STATE high SCHOOL ASSOCIATIONS. Based on Competition at the high SCHOOL Level in the 2014-15 SCHOOL Year BOYS GIRLS COMBINED. Sport (Number of states reporting Number of Number of Number of Number of Number of for boys/girls) Schools Participants Schools Participants Participants ADAPTED SPORTS (11/10). Basketball 76 546 70 434 980. Bocce Indoor 93 606 92 538 1,144. Bowling 128 953 126 745 1,698. Floor Hockey 62 244 62 170 414. Soccer 133 837 131 605 1,442. Softball 127 748 128 637 1,385. Track 105 740 106 680 1,420. AIR RIFLERY (2/1) 42 558 40 467 1,025. ARCHERY (8/6) 327 4,206 324 3,538 7,744. BADMINTON (3/7) 212 4,310 460 12,567 16,877. BASEBALL (48/24) 15,899 486,567 260 1,203 487,770. BASKETBALL (51/51) 18,072 541,479 17,653 429,504 970,983. BOCCE OUTDOOR (1/1) 63 375 62 399 774. BOWLING (27/25) 2,639 29,105 2,640 26,110 55,215. CANOE PADDLING (1/2) 57 1,254 60 1,236 2,490.
2 COMPETITIVE SPIRIT SQUADS (22/32) 687 2,687 5,358 125,763 128,450. CREW (7/7) 102 2,621 152 4,074 6,695. CROSS COUNTRY (51/51) 14,635 250,981 14,287 221,616 472,597. DANCE (5/11) 73 100 1,430 26,095 26,195. DANCE/DRILL (2/5) 9 32 427 7,007 7,039. DECATHLON (4/3) 71 253 28 196 449. DRILL TEAM (3/5) 56 669 341 5,703 6,372. EQUESTRIAN (3/5) 57 162 233 1,424 1,586. FENCING (5/4) 92 2,147 94 1,876 4,023. FIELD HOCKEY (5/20) 7 138 1,753 60,549 60,687. FLAG FOOTBALL (5/5) 32 838 278 9,059 9,897. FOOTBALL 11-Player (51/32) 14,154 1,083,617 467 1,565 1,085,182. 6-player (5/2) 247 4,403 1 4 4,407. 8-player (18/11) 832 19,423 32 92 19,515. 9-player (4/2) 251 5,112 10 37 5,149. GOLF (50/50) 13,528 148,823 9,824 72,582 221,405. GYMNASTICS (9/27) 122 2,079 1,550 18,557 20,636. HEPTATHLON (0/3) 36 76 76. ICE HOCKEY (18/17) 1,603 35,875 615 9,418 45,293. JUDO (1/1) 46 739 42 468 1,207. KAYAKING (1/1) 11 80 8 101 181. LACROSSE (25/25) 2,677 108,450 2,446 84,785 193,235.
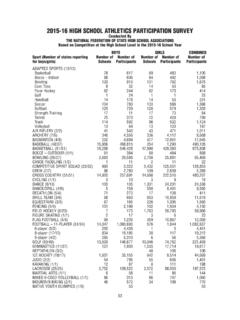
3 MIXED 6-COED VOLLEYBALL (1/1) 85 281 85 754 1,035. MOUNTAIN BIKING (2/1) 41 480 34 146 626. RIFLERY (10/10) 226 1,966 195 2,272 4,238. RODEO (3/3) 41 135 46 139 274. RUGBY (3/2) 31 1,334 13 265 1,599. SAILING (3/4) 23 151 23 130 281. SKIING ALPINE (13/13) 554 5,368 547 4,559 9,927. SKIING CROSS COUNTRY (13/13) 379 4,510 372 4,955 9,465. SNOWBOARDING (6/5) 56 647 49 307 954. SOCCER (51/51) 11,838 432,569 11,502 375,681 808,250. SOFT TENNIS (2/2) 15 143 17 237 380. SOFTBALL FAST PITCH (7/49) 70 1,425 15,115 364,103 365,528. 53. BOYS GIRLS COMBINED. Sport (Number of states reporting Number of Number of Number of Number of Number of for boys/girls) Schools Participants Schools Participants Participants SOFTBALL SLOW PITCH (1/5) 2 28 507 9,789 9,817. SURFING (1/1) 57 1,093 54 442 1,535. SWIMMING AND DIVING (48/48) 7,156 137,087 7,526 166,838 303,925. SYNCHRONIZED SWIMMING (1/3) 3 35 33 663 698. TEAM TENNIS (7/7) 1,565 24,990 1,583 26,337 51,327.
4 TENNIS (49/49) 9,725 157,240 10,099 182,876 340,116. TRACK AND FIELD INDOOR (20/20) 2,823 75,219 2,816 65,247 140,466. TRACK AND FIELD OUTDOOR (51/51) 16,358 578,632 16,309 478,726 1,057,358. VOLLEYBALL (24/51) 2,287 54,418 15,534 432,176 486,594. WATER POLO (9/7) 807 21,626 805 19,204 40,830. WEIGHTLIFTING (10/10) 794 19,902 559 10,499 30,401. WRESTLING (51/38) 10,597 258,208 1,806 11,496 269,704. OTHER 4 68 5 14 82. 54. NATIONAL FEDERATION OF STATE high SCHOOL ASSOCIATIONS. 2014-15 ATHLETICS PARTICIPATION SUMMARY. TEN MOST POPULAR BOYS PROGRAMS. Schools Participants 1. Basketball 18,072 1. Football 11-Player 1,083,617. 2. Track and Field Outdoor 16,358 2. Track and Field Outdoor 578,632. 3. Baseball 15,899 3. Basketball 541,479. 4. Cross Country 14,635 4. Baseball 486,567. 5. Football 11-Player 14,154 5. Soccer 432,569. 6. Golf 13,528 6. Wrestling 258,208. 7. Soccer 11,838 7. Cross Country 250,981. 8. Wrestling 10,597 8. Tennis 157,240.
5 9. Tennis 9,725 9. Golf 148,823. 10. Swimming and Diving 7,156 10. Swimming and Diving 137,087. TEN MOST POPULAR GIRLS PROGRAMS. Schools Participants 1. Basketball 17,653 1. Track and Field Outdoor 478,726. 2. Track and Field Outdoor 16,309 2. Volleyball 432,176. 3. Volleyball 15,534 3. Basketball 429,504. 4. Softball Fast Pitch 15,115 4. Soccer 375,681. 5. Cross Country 14,287 5. Softball Fast Pitch 364,103. 6. Soccer 11,502 6. Cross Country 221,616. 7. Tennis 10,099 7. Tennis 182,876. 8. Golf 9,824 8. Swimming and Diving 166,838. 9. Swimming and Diving 7,526 9. Competitive Spirit Squads 125,763. 10. Competitive Spirit Squads 5,358 10. Lacrosse 84,785. ATHLETICS PARTICIPATION SURVEY TOTALS. Boys Girls Boys Girls Year Participants Participants Total Year Participants Participants Total 1971-72 3,666,917 294,015 3,960,932 1994-95 3,536,359 2,240,461 5,776,820. 1972-73 3,770,621 817,073 4,587,694 1995-96 3,634,052 2,367,936 6,001,988.
6 1973-74 4,070,125 1,300,169 5,370,294 1996-97 3,706,225 2,474,043 6,180,268. 1975-76 4,109,021 1,645,039 5,754,060 1997-98 3,763,120 2,570,333 6,333,453. 1977-78 4,367,442 2,083,040 6,450,482 1998-99 3,832,352 2,652,726 6,485,078. 1978-79 3,709,512 1,854,400 5,563,912 1999-00 3,861,749 2,675,874 6,537,623. 1979-80 3,517,829 1,750,264 5,268,093 2000-01 3,921,069 2,784,154 6,705,223. 1980-81 3,503,124 1,853,789 5,356,913 2001-02 3,960,517 2,806,998 6,767,515. 1981-82 3,409,081 1,810,671 5,219,752 2002-03 3,988,738 2,856,358 6,845,096. 1982-83 3,355,558 1,779,972 5,135,530 2003-04 4,038,253 2,865,299 6,903,552. 1983-84 3,303,599 1,747,346 5,050,945 2004-05 4,110,319 2,908,390 7,018,709. 1984-85 3,354,284 1,757,884 5,112,168 2005-06 4,206,549 2,953,355 7,159,904. 1985-86 3,344,275 1,807,121 5,151,396 2006-07 4,321,103 3,021,807 7,342,910. 1986-87 3,364,082 1,836,356 5,200,438 2007-08 4,372,115 3,057,266 7,429,381. 1987-88 3,425,777 1,849,684 5,275,461 2008-09 4,422,662 3,114,091 7,536,753.
7 1988-89 3,416,844 1,839,352 5,256,196 2009-10 4,455,740 3,172,637 7,628,377. 1989-90 3,398,192 1,858,659 5,256,851 2010-11 4,494,406 3,173,549 7,667,955. 1990-91 3,406,355 1,892,316 5,298,671 2011-12 4,484,987 3,207,533 7,692,520. 1991-92 3,429,853 1,940,801 5,370,654 2012-13 4,490,854 3,222,723 7,713,577. 1992-93 3,416,389 1,997,489 5,413,878 2013-14 4,527,994 3,267,664 7,795,658. 1993-94 3,472,967 2,130,315 5,603,282 2014-15 4,519,312 3,287,735 7,807,047. 55. 2014-15 SUMMARY OF ATHLETICS PARTICIPATION . TOTALS BY STATE. State Boys Girls Total1 State Boys Girls Total1. 1. Texas 488,224 316,374 804,598 27. Tennessee 69,839 39,510 109,349. 2. California 462,401 334,700 797,101 28. Kansas 61,722 40,871 102,593. 3. New York 215,447 174,028 389,475 29. Louisiana 61,677 39,634 101,311. 4. Illinois 199,595 141,377 340,972 30. Oregon 56,577 43,599 100,176. 5. Ohio 189,955 129,974 319,929 31. Kentucky 52,529 43,996 96,525. 6. Pennsylvania 169,312 150,250 319,562 32.
8 South Carolina 59,719 35,671 95,390. 7. Michigan 171,027 124,633 295,660 33. Nebraska 45,716 31,421 77,137. 8. New Jersey 162,919 116,458 279,377 34. Arkansas 36,876 24,387 61,263. 9. Florida 154,650 113,304 267,954 35. Utah 35,265 24,723 59,988. 10. Minnesota 121,027 114,216 235,243 36. Maine 27,592 24,032 51,624. 11. Massachusetts 126,748 100,177 226,925 37. New Mexico 27,349 22,364 49,713. 12. Georgia 118,704 78,833 197,537 38. Nevada 26,511 18,522 45,033. 13. North Carolina 111,531 82,821 194,352 39. New Hampshire 24,191 20,837 45,028. 14. Wisconsin 109,827 76,768 186,595 40. Idaho 25,655 18,869 44,524. 15. Virginia 99,475 73,808 173,283 41. Hawaii 20,952 15,919 36,871. 16. Missouri 102,190 69,747 171,937 42. West Virginia 20,444 15,537 35,981. 17. Washington 92,160 68,085 160,245 43. Montana 17,425 13,930 31,355. 18. Indiana 90,890 61,662 152,552 44. Delaware 16,705 12,960 29,665. 19. Iowa 80,744 55,394 136,138 45. South Dakota 16,892 12,268 29,160.
9 20. Colorado 71,593 57,007 128,600 46. Rhode Island 16,565 11,921 28,486. 21. Alabama 80,510 42,829 123,339 47. North Dakota 14,469 10,604 25,073. 22. Arizona 71,259 50,926 122,185 48. Alaska 12,438 11,936 24,374. 23. Maryland 67,464 50,638 118,102 49. Wyoming 10,802 8,218 19,020. 24. Oklahoma 59,881 54,794 114,675 50. Vermont 8,001 6,888 14,889. 25. Mississippi 67,923 45,213 113,136 51. District of Columbia 7,160 4,676 11,836. 26. Connecticut 60,785 50,426 111,211. 1 Reflects PARTICIPATION rate, , individual who participated in two sports is counted twice, three sports . three times, etc. 56. BOYS PARTICIPATION . Competitive Baseball Basketball Bowling Spirit Squads State Schools Particip. Schools Particip. Schools Particip. Schools Particip. Alabama 383 12,080 408 12,860 42 171. Alaska 28 718 149 2,342 9 65 52 78. Arizona 241 7,914 255 7,969 74 294. Arkansas 255 5,590 272 5,133 67 699 32 93. California 1,265 44,325 1,395 44,829 9 170 112 308.
10 Colorado 279 8,248 330 8,764 172. Connecticut 179 6,175 185 5,454 39 173. Delaware 52 1,582 51 1,585 88. District of Columbia 659 986. Florida 601 17,973 666 16,656 167 1,283 222. Georgia 421 12,895 433 12,262 35 102. Hawaii 62 1,720 64 1,723 51 453 19 55. Idaho 92 2,377 143 3,561 42 138. Illinois 646 22,813 732 24,240 190 2,627. Indiana 385 11,137 397 11,004. Iowa 347 10,407 365 10,921 92 1,576. Kansas 230 6,501 351 8,803 75 992. Kentucky 258 7,087 269 6,465 95 1,022 197. Louisiana 341 8,407 374 7,938 79 557. Maine 130 3,275 141 3,558 10 67 15 25. Maryland 196 5,590 197 5,651 4 29. Massachusetts 352 13,130 364 12,569. Michigan 639 18,325 726 21,401 355 3,711. Minnesota 431 13,394 470 13,342. Mississippi 263 7,650 262 8,575 56 570 10 45. Missouri 596 15,345 562 14,115 6 51. Montana 176 3,453. Nebraska 76 2,395 301 7,396. Nevada 89 2,521 107 3,291 34 308. New Hampshire 85 2,464 86 2,509 14 120 76 34. New Jersey 402 15,296 425 14,754 228 2,871.