Transcription of 2014 World Population Data Sheet - assets.prb.org
1 Population reference BUREAUINFORM | EMPOWER | ADVANCE | 2 BILLIONW orldwide Population in 2014; 6 billion in less developed countries and billion in more developed total fertility rate worldwide. TFRs range from children per woman in Taiwan to in 1970, the global infant mortality rate declined from 80 infant deaths per 1,000 live births to 38 per 1,000 live percentage of the World s Population living in urban Population DATA SHEET2014 2014 Population reference bureau See notes on page 18 2014 World Population DATA Sheet 2 MOST POPULOUS COUNTRIES, 2014 AND 205020142050 COUNTRIES WITH THE HIGHEST AND LOWEST TOTAL FERTILITY RATESCOUNTRYPOPULATION (MILLIONS)
2 India1,657 China1,312 Nigeria396 United States395 Indonesia365 Pakistan348 Brazil226 Bangladesh202 Congo, Dem. (MILLIONS)China1,364 India1,296 United States318 Indonesia251 Brazil203 Pakistan194 Nigeria177 Bangladesh158 Russia144 Japan127 HIGHEST IN 2013 TFR20131970 Niger7. 67. 4 South Sudan7. , Dem. African 3 Mali6 ..17. 4 LOWEST IN , : 2013 data refer to latest data available. 2014 Population reference bureau See notes on page 18 2014 World Population DATA Sheet 3 Population CLOCK, 2014 WORLDMORE DEVELOPED COUNTRIESLESS DEVELOPED COUNTRIESP opulation7,238,184,0001,248,958,0005,989 ,225,000 Births perYear143,341,00013,794,000129,547,000 Day392,71437,7 9 2354,923 Minute27326246 Deaths perYear56,759,00012,328,00044,432,000 Day155,50533,775121,730 Minute1082385 Natural increase perYear86,581,0001,466,00085,115,000 Day2 37, 2 0 94,01723 3 ,19 3 Minute1653162 Infant deaths perYear5,507,00072,0005,435.
3 000 Day15,08719714,890 Minute100 .110 2014 Population reference bureau See notes on page 18 2014 World Population DATA Sheet 4W O RLD Population HIGHLIGHTSFOCUS ON PROGRESS AND CHALLENGESE xtreme Poverty Rate Falls in Many 1: ERADICATE EXTREME POVERTY AND HUNGERIn 2010, five years ahead of the target date of 2015, the World reached the United Nations Millennium Development Goal 1: cutting in half the proportion of people living in extreme poverty. While this global progress is outstanding, progress in particular countries and regions is not as strong.
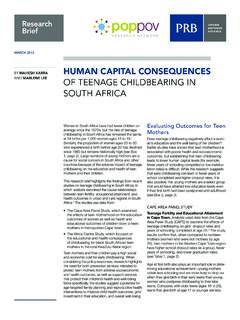
4 Globally, billion people still live on less than $ a day, and disproportionately large numbers of them live in southern Asia and sub-Saharan Africa. While the rate of extreme poverty fell significantly in China and India, their large populations (more than billion combined) mean that they are two of the top five countries that have the largest share of the global extreme : World Bank, Poverty Headcount Ratio at $ a Day (PPP), accessed at Mortality Rates Decline Steadily Across Much of the 4: REDUCE CHILD MORTALITYThe child mortality rate is the number of deaths of children under 5 per 1,000 live births. The United Nations set a target for Millennium Development Goal 4: to reduce by two-thirds, between 1990 and 2015, the under-5 mortality rate.
5 Across the globe, many countries have made significant progress in reducing child mortality. For example, child mortality in Bangladesh declined from 144 child deaths per 1,000 live births to 41, a reduction of 72 percent. The global rate in 2012 was almost one-half its 1990 rate, declining from 90 deaths per 1,000 live births to 48 in 2012. Despite these gains, many countries will fall short of the MDG target, and further progress is needed across much of sub-Saharan Africa and South Asia. SOURCE: UN Inter-agency Group for Child Mortality Estimation, Under-Five Mortality Estimates: Rates (September 2013), accessed at 22 World62 12 China37 20 Honduras54 33 India54 19 Indonesia66 30 Senegal 69 38 Uganda Percent of Population Living on Less Than $ Congo, Dem.
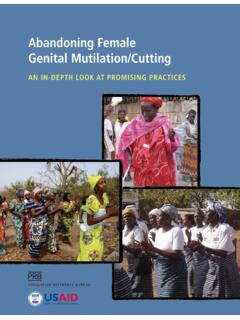
6 Rep. (15%)Somalia (17%)Angola (23%)Vietnam (54%)Algeria (60%)Uganda (61%)Tanzania (68%)Bangladesh (72%)China (74%)Egypt (75%)Peru (77%)Kenya (26%)Papua New Guinea (29%)Burkina Faso (49%)Yemen (52%)66% or Greater Reduction33% 65%ReductionLess Than 33% Reduction1814415469202360102637316414714 6217954144505117117721398892021251781668 6 Deaths of Children Under 5 per 1,000 Live Births (2012 data appear inside bars; 1990 data are italicized) 2014 Population reference bureau See notes on page 18 2014 World Population DATA Sheet 519 70 Male Female 2014 Male Female Age Structure Has Changed Differently Across Regions Between 1970 and 1970, just under one-half (48 percent) of the World s Population was younger than 20, a nearly equal percentage was ages 20 to 64, and only 5 percent was 65 and older.
7 Today, as a result of lower fertility rates and longer life expectancy, the share of global Population under age 20 has dropped to about 35 percent, the Population between ages 20 and 64 represent 58 percent, and ages 65 and older represent 7 percent. Asia, Latin America, and Oceania all have Population age structures similar to the global averages. In 1970, Europe and North America were similar to the World average today, and their slower growth resulted in a current Population much older than the global average. Africa s Population is at the other end of the age spectrum Africa s current youthful age structure is much like the global average in : United Nations Population Division, World Population Prospects: The 2012 Revision (New York: United Nations, 2013).
8 W O RLD Population HIGHLIGHTSFOCUS ON PROGRESS AND CHALLENGES10% 8% 6% 4% 2% 0% 2% 4% 6% 8% 10% 0-4 5-9 10-14 15-19 20-24 25-29 30-34 35-39 40-44 45-49 50-54 55-59 60-64 65-69 70-74 75-79 80+ Percent of PopulationLatin America & Caribbean10% 8% 6% 4% 2% 0% 2% 4% 6% 8% 10% 0-4 5-9 10-14 15-19 20-24 25-29 30-34 35-39 40-44 45-49 50-54 55-59 60-64 65-69 70-74 75-79 80+ Percent of PopulationAfrica10% 8% 6% 4% 2% 0% 2% 4% 6% 8% 10% 0-4 5-9 10-14 15-19 20-24 25-29 30-34 35-39 40-44 45-49 50-54 55-59 60-64 65-69 70-74 75-79 80+ Percent of PopulationNorth America10% 8% 6% 4% 2% 0% 2% 4% 6% 8% 10% 0-4 5-9 10-14 15-19 20-24 25-29 30-34 35-39 40-44 45-49 50-54 55-59 60-64 65-69 70-74 75-79 80+ Percent of PopulationAsia10% 8% 6% 4% 2% 0% 2% 4% 6% 8% 10% 0-4 5-9 10-14 15-19 20-24 25-29 30-34 35-39 40-44 45-49 50-54 55-59 60-64 65-69 70-74 75-79 80+ Percent of PopulationOceania10% 8% 6% 4% 2% 0% 2% 4% 6% 8% 10% 0-4 5-9 10-14 15-19 20-24 25-29 30-34 35-39 40-44 45-49 50-54 55-59 60-64 65-69 70-74 75-79 80+ Percent of PopulationEurope10% 8% 6% 4% 2% 0% 2% 4% 6% 8% 10% 0-4 5-9 10-14 15-19 20-24 25-29 30-34 35-39 40-44 45-49 50-54 55-59 60-64 65-69 70-74 75-79 80+ Percent of PopulationWorld 2014 Population reference bureau
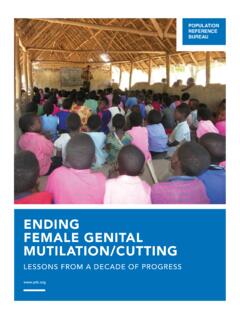
9 See notes on page 18 2014 World Population DATA Sheet 6 Countries Vary in Progress Toward Reducing Still-High Maternal 5: IMPROVE MATERNAL HEALTHThe maternal mortality ratio is the number of maternal deaths per 100,000 live births. Globally, this ratio dropped from 380 deaths to 210 deaths per 100,000 live births between 1990 and 2013. Some countries have made remarkable progress. For example, maternal mortality in Rwanda declined from 1,400 maternal deaths per 100,000 live births to 320, a reduction of 77 percent. Even with these drops, many countries have not yet met the United Nations target for Millennium Development Goal 5: to reduce by three-quarters, between 1990 and 2015, the maternal mortality ratio.
10 While the ratio has declined rapidly in some countries, many others have made insufficient progress. The ratio for all developing countries is 14 times higher than for developed countries 230 maternal deaths per 100,000 live births vs. 16, and further efforts are needed to end these preventable maternal deaths. SOURCE: World Health Organization, Trends in Maternal Mortality: 1990 to 2013 (Geneva: WHO, 2014).As Life Expectancy Rises in the United States, Gaps Between Whites and Blacks Are 1975, life expectancy at birth in the United States has increased by 10 years for black males, by 7 years for white males and black females, and by only 4 years for white females.