Transcription of 2017 Public Transportation Fact Book - apta.com
1 AMERICAN Public Transportation ASSOCIATIONFACT book Public TRANSPORTATION2017 2017 Public Transportation FACT book 68th Edition March 2018 APTA s Vision Statement Be the leading force in advancing Public Transportation . APTA s Mission Statement APTA serves and leads its diverse membership through advocacy, innovation, and information sharing to strengthen and expand Public Transportation . Primary Author: MacPherson Hughes-Cromwick, Policy Analyst (202) 496-4812 Data and Analysis: Matthew Dickens, Senior Policy Analyst (202) 496-4817 American Public Transportation Association Paul P. Skoutelas, President and CEO APTA Policy Department Darnell C.
2 Grisby, Director-Policy Development & Research Arthur L. Guzzetti, Vice President-Policy American Public Transportation Association 1300 I Street, NW, Suite 1200 East Washington, DC 20005 TELEPHONE: (202) 496-4800 E-MAIL: 4 | Page Contents Overview of Public Transit Systems ..5 Total Number of Systems, Number of Modes Operated, 2015 Rail Openings Passenger Travel ..7 Unlinked Passenger Trips by Mode, Unlinked Passenger Miles by Mode, Average Trip Length by Mode, VMT vs. Passenger Mile Growth, Population vs. Ridership Growth, ACS Transit Commuting Statistics Service Provided .. 12 Vehicle Revenue Miles Operated, Vehicle Revenue Hours Operated, Modal Shares of Service Vehicles.
3 13 Vehicles Available for Maximum Service, Vehicle Age by Mode, Vehicle Accessibility, Bus Passenger Equipment, Bus Fuel Type, Total Mechanical Failures, Revenue Vehicle Maintenance Infrastructure .. 16 Rail Directional Route Miles by Mode, Average Station Spacing, Passenger Station Amenities, Transit Station Accessibility, Percentage of Systems with Smart Cards Employment .. 18 Total Employees, Employees by Function, Employees by Mode, Transit Employee Compensation, Average Employee Compensation Energy and Environment .. 19 Fossil Fuel Consumption, Bus Fuel Consumption, Demand Response Fuel Consumption, Rail Vehicle Miles Operated per Kilowatt Hour Safety.
4 21 Total Transit Related Fatalities Capital and Operating Expenses .. 21 Capital Expenses, Rolling Stock Expenditures, Capital Facility Expenditures, Operating Expenses, Comparative Operating Costs Among Modes Capital and Operating Funding .. 24 Total Transit Funding, Passenger Fare Revenue, Average Base Fare, Capital Funding by Source, Operating Funding by Source Transit Spending and Contracting in the Private Sector .. 26 Estimated Expenditures in the Private Sector, Revenue Hours Contracted Canadian Summary Data .. 28 Passenger Boardings, Total Vehicle Miles, Revenue Vehicles, Total Employees Amtrak .. 29 Top 10 Routes by Ridership, Top 15 Busiest Stations Modal Rankings.
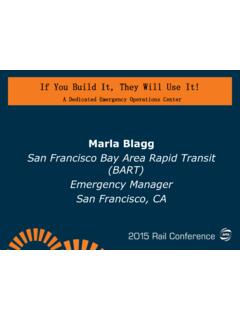
5 30 National Totals for Selected Modes, 50 Largest Agencies, 50 Metros with Most Transit Travel, Listing of Largest Agencies by Mode, Listing of Largest Rural Agencies by Mode APTA and the Fact book .. 44 OVERVIEW OF Public TRANSIT SYSTEMS 5 | Page Overview of Public Transit Systems In 2015, more than 6,700 organizations provided Public Transportation in a variety of modes. Non-profit providers make up many of these systems, and typically operate demand-response services targeted at older Americans and persons with Of the 83 rail systems now operated by transit agencies, only nine rail systems have been operating since the 19th Century.
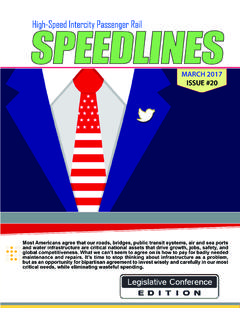
6 The number of rail systems continued to grow with the opening of two new systems in 2015 (the Dallas streetcar and the Charlotte streetcar). Compared to 1995, there are 17 additional commuter/hybrid rail systems and 13 additional light rail/streetcar systems. 1 Urbanized areas are defined as areas with over 50,000 in population. 3315350102030405060708090198519861987198 8198919901991199219931994199519961997199 8199920002001200220032004200520062007200 82009201020112012201320142015 Total Number of Rail SystemsCommuter RailHeavy RailLight Rail84113034586 Number of Systems Urbanized AreasRuralNon-Profit Providers63401168226 Number of Modes OperatedDemand ResponseTotal Bus and TrolleybusOtherPASSENGER TRAVEL 6 | Page The number of demand response systems recorded has fallen slightly while the number of ferryboat systems has remained at 41, up 9 from 2010.
7 The number of bus systems (including commuter and bus rapid transit) has declined for a third straight year. Bus Rapid Transit (BRT) systems continue to gain in popularity as lower cost options to providing high capacity and efficient Transportation . The Federal Transit Administration defines BRT as a fixed route system operating at least 50 percent of the service on a fixed guideway. Twelve BRT systems were operating in 2015, which is double that of 2010. Cities like Los Angeles and Portland continue to add new lines to their rail networks, making high-quality transit available to more people. Other cities like Seattle, Salt Lake City, Phoenix, and Denver have recently built new rail systems from the ground up, dramatically increasing their ridership.
8 From 2000 to the end of 2015, 43 new systems and 103 extensions (both rail and busway) have opened, resulting in 548 and 595 new segment miles, respectively. The table below lists all of the openings and extensions that took place in 2015. 2015 Rail Openings 7,3007,2006,7006,7416,6006,5116,2706,370 6,3405,0005,5006,0006,5007,0007,5008,000 8,5009,0009,50010,0002007200820092010201 12012201320142015 Number of Demand Response Systems1,2001,0861,0881,2061,1751,3651,2 681,2231,16302004006008001,0001,2001,400 1,60020072008200920102011201220132014201 5 Number of Bus Systems (total)Chicago, ILChicago Transit AuthorityHRGreen Line---12/8/2015 Added StationDallas, TXDallas Area Rapid TransitSCDallas Streetcar, Oak Cliff Phase SystemHouston, TXMetropolitan Transportation Authority of Harris CountyLRGreen East End , TXMetropolitan Transportation Authority of Harris CountyLRPurple Southeast , NCCharlotte Area Transit SystemSCCityLYNX Gold SystemCleveland, OHGreater Cleveland Regional Transit AuthorityHRRed Line---18/11/2015 Added StationPhoenix, AZValley MetroLRValley Metro Rail, Mesa , CASacramento Regional Transit DistrictLRBlue.
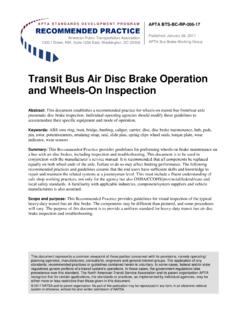
9 ORTri-County Metropolitan Transportation District of OregonLRMAX Orange York, NYMTA New York City TransitHRNo. 7 , DCVirginia Railway ExpressCRFredericksburg PASoutheastern Pennsylvania Transportation AuthorityCRLansdale Station---111/16/2015 Added StationNew System/ Extension/Added StationDate OpenedUrbanized Area (First City Name Only)Organization NameModeSegment Line or Route NameLine Segment MilesNumber of Added StationsPASSENGER TRAVEL 7 | Page Passenger Travel Public Transportation provided billion unlinked passenger trips in 2015, falling percent from its recent high of billion in 2014. Since the early 1970s, Public Transportation has shown long-term growth in ridership with over 44 percent more trips in 2015.
10 When dissecting by mode, bus ridership declined by percent from 2014-2015, and is down 8 percent from 2000. Heavy rail ridership declined by percent from 2014-2015 but remains 46 percent above 2000 levels. Light rail and streetcar ridership declined by less than a percent from 2014-2015 but is up 65 percent from 2000. Commuter rail ridership increased by 1 percent from 2014-2015, and is up 22 percent from 2000. Finally, while demand response ridership is down 4 percent from 2014-2015, it is more than double its 2000 ridership. Unlinked Passenger TripsBus, BRT, Trolleybus49%Commuter Bus1%Demand Response2%Commuter and Hybrid Rail5%Heavy Rail36%Light Rail and Streetcar5%Other2%Unlinked Passenger Trips by Mode (2015)PASSENGER TRAVEL 8 | Page While roadway modes continue to make up a majority of the unlinked passenger trips taken, fixed-guideway modes (primarily heavy and light rail modes) are making up an increasing percentage of trips, and may soon overtake roadway modes.