Transcription of 2020FACTS & FIGURES
1 2020 FACTS & AEROSPACE & DEFENSEEXECUTIVE SUMMARYS ince its establishment over a century ago, the Aerospace Industries Association (AIA) has served as the premier advocate and convener of choice for America s aerospace and defense (A&D) industry. From the trials of world wars to the pressures of the Space Race, our industry has met countless challenges head on and persevered. In 2020, we are once again facing an unprecedented challenge: the COVID-19 pandemic. Global air traffic has dramatically decreased as the world fights this deadly virus. Civil aerospace, which accounts for 61% of our industry, has been particularly hard hit, with the impact likely felt for years to come. However, our industry is ready to overcome this newest hurdle, building on the success we saw in 2019.
2 Looking back on the world before COVID-19, the A&D industry maintained its decade-long growth trend. With increases in nearly every metric and an economic footprint that represented of total Gross Domestic Product (GDP), 2019 could be considered one of the best on record for our industry. Our workforce, the cornerstone on which our industry s success has been built, grew by and boasted average wages and benefits 46% higher than the national average . These high wages were supported by a increase in industry sales revenue, which formed a combined contribution of $ billion to federal, state, and local tax coffers. These FIGURES , once again, underscore our industry s vital role in the American we have for more than a century, AIA is proud to continue its publication of this report, which has traditionally served as a year-in-review for industry statistics.
3 However, this year s installment, 2020 Facts & FIGURES : Aerospace & Defense, not only provides a snapshot of our industry as it stood at the end of 2019, but also considers the impact of the pandemic on our industry in the first half of 2020. In the coming years, the COVID-19 crisis will create unprecedented challenges for our industry and country. But just as we have throughout our history, we stand ready to overcome this crisis with the same ingenuity and determination that has defended this nation for decades and helped humans to not only touch the skies, but surpass them. EDITOR S NOTEAn important note for this year s edition is a change in the statistical methodology used in our economic impact modelling. This change, which primarily affected FIGURES relating to our supply chain, has resulted in a significant comparative difference to statistics reported in our 2019 edition.
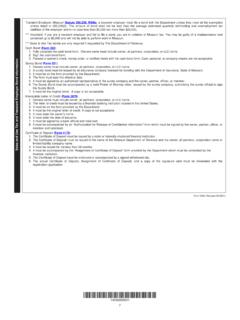
4 All references to previous year s statistics, such as year-over-year growth, use statistics developed under this new methodology. WORKERSIN TOTAL INDUSTRYSALES REVENUEIN EXPORTSAVERAGE A&D INDUSTRYWAGE AND BENEFITS2 .19M$909B$148B$102,9002019 HIGHLIGHTED STATISTICS1 EMPLOYMENTThe aerospace and defense workforce continues to be the bedrock of our industry s success. At nearly million strong in 2019, A&D workers represented of America s total workforce. This was a nearly five percent increase in the total industry workforce from 2018. Around 58% of industry employment was attributed to the supply chain. Of end-use A&D companies, commercial aerospace held the largest share of employees (49% of that total). Reflecting the highly skilled jobs they hold, our workers continued to receive wages and benefits far higher than the national average , with the average A&D worker receiving around $102,900 in wages and benefits.
5 This was 46% higher than the comparable national average for all workers. Collectively, the industry paid out more than $226 billion in wages and benefits in 2019, a increase over the previous year. The impact of commercial and government sales on our workforce cannot be understated. Four jobs are created for every million dollars in direct sales revenue generated by the industry. These jobs not only provide higher than average compensation, but also support their local communities. In 2019, the A&D industry contributed to $ billion in state and local tax revenues and $46 billion in federal tax revenue. 2 Photo Credit: Lockheed MartinA&D INDUSTRY EMPLOYMENT320 162, 02 6, 78 9 Supply ChainFull Industry Impact20 182, 096, 81 4 Full Industry Impact20 192, 19 7, 71 9 Full Industry Impact20 172, 02 4, 67 9 Full Industry ImpactEnd-UseAeronautics/AircraftSpaceLa nd & Sea SystemsCyber1, 175, 207851, 582553, 18376,2 60144, 00578,1 34 Supply ChainEnd-UseAeronautics/AircraftSpaceLan d & Sea SystemsCyber1, 173, 191851, 488551, 54775,3 33144, 11780,490 Supply ChainEnd-UseAeronautics/AircraftSpaceLan d & Sea SystemsCyber1, 216, 153880,6 62573, 18076,3 98147, 95183,1 33 Supply ChainEnd-UseAeronautics/AircraftSpaceLan d & Sea SystemsCyber1, 275, 100922, 619602, 07281,7 04152, 89385,9 48 INDUSTRY OUTPUTAs 2019 drew to a close.
6 The A&D industry posted strong annual growth with combined industry sales revenue amounting to $909 billion, a increase from 2018 industry output. Of these sales, $399 billion was attributed to our extensive, shared supply chain that supports both our aerospace and defense sectors. The companies making up our industry s supply chain provide vital products for end use manufacturers, such as bolts, wiring, hoses, and electronics. The total industry sales revenue left a significant footprint on the American economy, contributing to a combined economic value of $396 billion that represented of total GDP. Space systems led industry growth, with a nearly 9% surge in sales from 2018. With the announcement of NASA s Artemis program and the founding of the Space Force in 2019, the space subsector appears well-positioned for future growth as our nation embraces its next frontier.
7 Despite difficult circumstances in commercial aviation during the year, commercial aerospace managed to post strong gains, boasting a 7% growth in sales and a growth in its contribution to GDP. Photo Credit: Spirit Aerosystems52019$909B Industry TotalEnd-UseSubsectors(By Product)Supply ChainAeronautics/AircraftSpaceLand & Sea SystemsCyber$400B $387B $42B $61B $19B End Use $509B 56%Supply Chain $400B 44%2019 A&D INDUSTRY OUTPUTV alue in BillionsTRADEThe impact of turbulence in the civil aviation market was most evident in the nation s A&D industry export and import values. civil aerospace exports in 2019 were valued at $ billion, a 4% decline from the previous year. Meanwhile, defense exports increased by to a three-year high of $ billion.
8 This growth softened the 2% decline in total A&D exports. When combined with a 12% growth in A&D imports, the industry s trade balance decreased to $79 billion in 2019, representing the fifth highest annual A&D trade balance since 2010. In 2019, France emerged as the nation s top A&D export destination, importing $ billion in American A&D products in 2019. This was slightly higher than France s A&D imports in the prior year, with a modest increase of around $100 million. France also continued to be the top country of origin for America s A&D imports, as the value of its cumulative A&D exports to the United States surged by 31% to a ten-year high of $ billion. This was largely fueled by a nearly $ billion increase in turbojet engine-related imports from French manufacturers, as well as a $673 million increase in imports of large civil aircraft.
9 Imports from Canada and the United Kingdom also grew, with those countries becoming the second and third biggest exporters of A&D products to the United States Credit: Rolls-Royce7 TOP EXPORT DESTINATIONSTOP IMPORT ORIGINS123456789 10123456789 10 Japan $ $ $ $ $ $ Kingdom $ $ $ $ $ $ $ $ $5B$10B$15B$20B0$3B$6B$9B$12B$15 BFrance $ Kingdom $ $ $ Arab Emirates $ $ 10123456789 10 Japan $ $ $ $ $ $ Kingdom $ $6 Germany $ $ $ $ $ $ $5B$10B$15B$20B0$3B$6B$9B$12B$15 BFrance $ Kingdom $ $ $ Arab Emirates $ $ in BillionsValue in BillionsTOTAL A&D TRADE BALANCE201020112012201320142015201620172 0182019$ $ $ $ $20B$40B$60B$80B$100B$ $ $ $ $ $ in Billions8 Imports$68.
10 7 BExports$ BIndustryTr adeStatisticsDefense$ %Commercial $ %IndustryExportsTotal $ Bohrer, National Association of Manufacturers Click Bond $ $ $ $ $20B$40B$60B$80B$100B$ $ $ $ $ $ $68. 7 BExports$ BIndustryTr adeStatisticsDefense$ %Commercial $ %IndustryExportsTotal $ Bohrer, National Association of Manufacturers Click Bond STATES FOR A&D The A&D industry saw business growth in 49 states and the District of Columbia in 2019. The only outlier was Maryland, whose statewide sales shrank by roughly The states that saw the biggest relative A&D sales growth to the prior year were Wyoming (21%), Vermont (15%), South Carolina (12%), Missouri (11%), and Nevada (11%). The State of Washington remained the national hub of the A&D industry, accounting for 15% of all A&D industry sales with $137 billion in statewide revenue.