Transcription of 203-30: Principal Component Analysis versus Exploratory ...
1 1 Paper 203-30 Principal Component Analysis vs. Exploratory Factor Analysis Diana D. Suhr, University of Northern Colorado Abstract Principal Component Analysis (PCA) and Exploratory Factor Analysis (EFA) are both variable reduction techniques and sometimes mistaken as the same statistical method. However, there are distinct differences between PCA and EFA. Similarities and differences between PCA and EFA will be examined. Examples of PCA and EFA with PRINCOMP and FACTOR will be illustrated and discussed. Introduction You want to run a regression Analysis with the data you ve collected.
2 However, the measured (observed) variables are highly correlated. There are several choices use some of the measured variables in the regression Analysis (explain less variance ) create composite scores by summing measured variables (explain less variance ) create Principal Component scores (explain more variance ). The choice seems simple. Create Principal Component scores, uncorrelated linear combinations of weighted observed variables, and explain a maximal amount of variance in the data. What if you think there are underlying latent constructs in the data? Latent constructs cannot be directly measured influence responses on measured variables include unreliability due to measurement error.
3 Observed (measured) variables could be linear combinations of the underlying factors (estimated underlying latent constructs and unique factors). EFA describes the factor structure of your data. Definitions An observed variable can be measured directly, is sometimes called a measured variable or an indicator or a manifest variable. A Principal Component is a linear combination of weighted observed variables. Principal components are uncorrelated and orthogonal. A latent construct can be measured indirectly by determining its influence to responses on measured variables. A latent construct could is also referred to as a factor, underlying construct, or unobserved variable.
4 Unique factors refer to unreliability due to measurement error and variation in the data. Principal Component Analysis minimizes the sum of the squared perpendicular distances to the axis of the Principal Component while least squares regression minimizes the sum of the squared distances perpendicular to the x axis (not perpendicular to the fitted line) (Truxillo, 2003). Principal Component scores are actual scores. Factor scores are estimates of underlying latent constructs. Eigenvectors are the weights in a linear transformation when computing Principal Component scores. Eigenvalues indicate the amount of variance explained by each Principal Component or each factor.
5 Orthogonal means at a 90 degree angle, perpendicular. Obilque means other than a 90 degree angle. An observed variable loads on a factors if it is highly correlated with the factor, has an eigenvector of greater magnitude on that factor. Communality is the variance in observed variables accounted for by a common factors. Communality is more relevant to EFA than PCA (Hatcher, 1994). Principal Component Analysis (PCA) Is a variable reduction technique Is used when variables are highly correlated Reduces the number of observed variables to a smaller number of Principal components which account for most of the variance of the observed variables Is a large sample procedure Statistics and Data AnalysisSUGI30 2 The total amount of variance in PCA is equal to the number of observed variables being analyzed.
6 In PCA, observed variables are standardized, , mean=0, standard deviation=1, diagonals of the matrix are equal to 1. The amount of variance explained is equal to the trace of the matrix (sum of the diagonals of the decomposed correlation matrix). The number of components extracted is equal to the number of observed variables in the Analysis . The first Principal Component identified accounts for most of the variance in the data. The second Component identified accounts for the second largest amount of variance in the data and is uncorrelated with the first Principal Component and so on.
7 Components accounting for maximal variance are retained while other components accounting for a trivial amount of variance are not retained. Eigenvalues indicate the amount of variance explained by each Component . Eigenvectors are the weights used to calculate components scores. Exploratory Factor Analysis (EFA) Is a variable reduction technique which identifies the number of latent constructs and the underlying factor structure of a set of variables Hypothesizes an underlying construct, a variable not measured directly Estimates factors which influence responses on observed variables Allows you to describe and identify the number of latent constructs (factors)
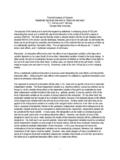
8 Includes unique factors, error due to unreliability in measurement Traditionally has been used to explore the possible underlying factor structure of a set of measured variables without imposing any preconceived structure on the outcome (Child, 1990). Figure 1 below shows 4 factors (ovals) each measured by 3 observed variables (rectangles) with unique factors. Since measurement is not perfect, error or unreliability is estimated and specified explicitly in the diagram. Factor loadings (parameter estimates) help interpret factors. Loadings are the correlation between observed variables and factors, are standardized regression weights if variables are standardized (weights used to predict variables from factor), and are path coefficients in path Analysis .
9 Standardized linear weights represent the effect size of the factor on variability of observed variables. Figure 1. Diagram of four factor model Variables are standardized in EFA, , mean=0, standard deviation=1, diagonals are adjusted for unique factors, 1-u. The amount of variance explained is the trace (sum of the diagonals) of the decomposed adjusted correlation matrix. Eigenvalues indicate the amount of variance explained by each factor. Eigenvectors are the weights that could be used to calculate factor scores. In common practice, factor scores are calculated with a mean or sum of measured variables that load on a factor.
10 Statistics and Data AnalysisSUGI30 3 In EFA, observed variables are a linear combination of the underlying factors (estimated factor and a unique factor). Communality is the variance of observed variables accounted for by a common factor. Large communality is strongly influenced by an underlying construct. Community is computed by summing squares of factor loadings d12 = 1 communality = % variance accounted for by the unique factor d1 = square root (1-community) = unique factor weight (parameter estimate) Similarities PCA and EFA have these assumptions in common: Measurement scale is interval or ratio level Random sample - at least 5 observations per observed variable and at least 100 observations.