Transcription of 384-2008: Structural Equation Modeling and Path …
1 Paper 384-2008 Structural Equation Modeling and path analysis Using PROC TCALIS in SAS Yung, SAS Institute Inc., Cary NCABSTRACTThe TCALIS procedure, which is new and experimental in SAS , is a major enhancement of the CALIS the TCALIS and CALIS procedures provide statistical tools for analyzing Structural equations and related models,although the new features are available only in PROC TCALIS. In this paper, practical examples are used to illustratesome PROC TCALIS features: the path Modeling language, customization of the fit summary table, effects partitioning,the multiple-group model, analysis of mean structures, and simultaneous tests of parametric functions.
2 Other importantfeatures of PROC TCALIS are also Equation Modeling is a sophisticated statistical method that can model complicated functional or causal relationships among variables, whether the variables are observed (that is, manifest variables) or not (that is, latentvariables). Structural Equation Modeling has a wide range of applications. In health science research, structuralequation Modeling has been used to identify factors associated with substance abuse and personality disorders. Inmarketing research, Structural Equation models have been used to suggest ways to improve Web-page design toenhance the Web-browsing experience. For an introduction to Structural Equation Modeling , seeBollen(1989) orLoehlin(2004).
3 PROC CALIS fits Structural Equation models. In SAS , PROC TCALIS provides a major update of PROC of the popular features of PROC CALIS are available in PROC TCALIS. This paper highlights some new featuresin PROC TCALIS. Specifically, the following new features are illustrated with two examples: path Modeling language enables you to specify your path model easily effect analysis with the EFFPART statement enables you to look at direct, indirect, and total effects in customiz-able ways multiple-group analysis enables you to study the similarities and differences among independent groups enhanced mean structure analysis enables you to analyze the mean structures simultaneously with the covari-ance structures simultaneous tests of parametric functions with the SIMTEST statement enables you to test specific a priorihypotheses simultaneouslyOther important new features of PROC TCALIS are summarized in the CONCLUSION Equation MODELS AND path DIAGRAMSMany Structural Equation models are represented by path diagrams.
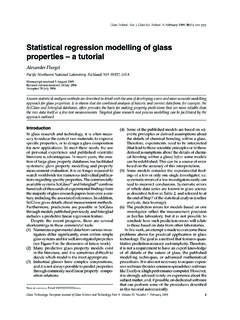
4 With which researchers describe their theoriesabout the relationships among variables. For example, a researcher has a complicated theory about how mental ability,achievement motivation, and the academic success of a student depend on his or her social background, family size,and parental encouragement. In his theory, these variables are related by a series of causal chains. The researcherstarts with a representation of his causal theory and hopes to see that the data lend support to his , the researcher explicates his theory by using a path diagram. Inspired by the theoretical model ofMarjoribanks(1974), Figure 1shows an example of such a path diagram representation of the researcher s causal theory about themental abilities of and Data AnalysisSASG lobalForum2008 Figure 1 Factors Affecting Mental Abilities: path DiagramSocial StatusS1S2S3 Parental EncouragementP1P2P3 Family SizeAchievement MotivationA1A2A3 Mental AbilityM1M2M3 The path diagram shown inFigure 1is modified fromMarjoribanks(1974), and it is not intended to perfectly representthe theoretical model ofMarjoribanks(1974).
5 The data in the current illustration are fictitious, so no part of the currentanalysis is meant to be comparable to the results ofMarjoribanks(1974). Here, the purpose is to illustrate the newPROC TCALIS features in an interesting substantive the path diagram,Mental Abilityis predicted directly byParental EncouragementandAchievement Motivation. In turn,Parental Encouragementis predicted bySocial Status, andAchievement Motivationis predicted bySocial Status,Family Size,andParental Encouragement. The path diagram also implies that the effects ofSocial StatusandFamily SizeonMental Abilityare only indirect: they affectMental Abilityonly through their effects onParental EncouragementandAchievement , some variables serve dual roles as predictors and outcomes in the path diagram.
6 For example,ParentalEncouragementis a predictor variable ofMental AbilityandAchievement Motivation; but at the same time it is an outcomevariable ofSocial Status. These important relationships among the theoretical variables are referred to as structuralrelationships. The corresponding model for these relationships is called astructural path -diagram representation of complicated Structural relationships is much more than a description of a fewpredictors and outcome blocks. This means that you cannot simply use multiple regression techniques to analyzesuch a Structural model. For example, consider a regression ofMental AbilityonParental EncouragementandAchievementMotivationby using the following statements:proc reg;model MentalAbility = ParentalEncouragement AchievementMotivation;run;The problem with this regression analysis is that it ignores the common causes of the two predictors and the regression(or dependency) ofAchievement MotivationonParental now a regression ofMental AbilityonSocial StatusandFamily Sizeas follows:proc reg;model MentalAbility = SocialStatus FamilySize;run.
7 The problem with this regression analysis is that it incorrectly models theindirecteffects ofSocial StatusandFamily SizeonMental addition to the limitations in treating complicated causal relationships, multiple regression techniques cannot treatlatent variables, which are represented by ovals in the path diagram. The variablesSocial Status,Parental Encouragement,Achievement Motivation, andMental Abilityare all latent variables, and hence are not available in the input data and Data AnalysisSASG lobalForum2008 All the previously described issues call for Structural Equation Modeling techniques, which can handle observed andlatent variables and analyze the entire complicated path model.
8 PROC TCALIS provides you with such structuralequation Modeling techniques. Specifically, you can use the newly developed path Modeling language in PROCTCALIS to input your path model with diving into the path Modeling specification, some more details about the the path diagram are needed. Themeasurement indicators inFigure 1have been ignored in the exposition of the Structural model. These indicatorsreflect the underlying latent constructs that are linked to them. For example, there are three indicator measures forMental Ability:M1,M2, andM3. These three variables could be mental tests administered to the individuals in be a verbal test,M2could be a math test, andM3could be a test of reasoning skills.
9 Similarly, otherlatent variables in the path diagram are associated with different sets of observed indicators. The part of the model thatlinks the latent variables to their observed indicators is called themeasurement , the indicator and its associated latent variable take the following form of relationship in the measurementmodel:indicatorDlatent constructCmeasurement errorIn the path diagram, this translates into the following path :indicator latent constructIn the current path -diagram notation, the measurement error in the path is implicitly assumed. There is no need todepict the error terms explicitly in the path diagram. Hence, the path diagram shown inFigure 1provides a completeaccount of the researcher s causal theory, which contains the Structural model and the measurement path Modeling LANGUAGE IN PROC TCALISG iven the path diagram shown inFigure 1, you are almost ready to translate it into the path Modeling language sup-ported by PROC TCALIS.
10 But first, you need to define some important parameters in the YOUR path DIAGRAM INTO THE path STATEMENT SPECIFICATIONTo make the correspondence between the path diagram and the path statement specification in PROC TCALIS moreobvious, you insert the path effect or coefficient parameters into the path diagram inFigure 1. Figure 2shows such anupdated version of the path 2 Factors Affecting Mental Abilities: path Diagram with ParametersSocial Sizet4 Achievement and Data AnalysisSASG lobalForum2008 In Figure 2, either a parameter name or a value of1:0is added to each path in the diagram. Parameterst1,t2, ..,t7represent the direct path effects or regression coefficients in the Structural model.