Transcription of 92.4 -1.50 869 - Cape Town
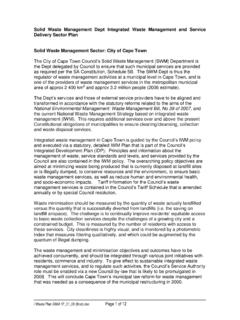
1 WEEKLY WATER means Western Cape Water Supply SystemMLD means million litres per dayMore information on Water Saving and Restrictions is available on the City of Cape Town's 'ThinkWater' website08 August 2022 Headline StatisticsWater Production from Different SourcesOveral Water Usage Trend (2010 - Present)MAJOR DAMS(MLD)GROUND WATERANDSPRINGS(MLD)MINOR DAMS(MLD)WCWSS DAM STORAGE(%)WEEKLY DAM LEVEL CHANGE (%)AVERAGE TOTALDAILY WATER USE (MLD) 0001 2001 400 Dec-12 Dec-13 Dec-14 Dec-15 Dec-16 Dec-17 Dec-18 Dec-19 Nov-20 Nov-21 Nov-22 Nov-23 Water Use (MLD)Water Stored in Major Dams (WCWSS)Overall Percentage August 2022 Previous week2021202020192018 BERG RIVER130 LOWER33 UPPER31 LVLEI164 STORED898 221677 860678 455873 133699 524708 311517 240% Storage Record (2008 - Present)WCWSS Comparative Storage GraphMAJOR DAMS (WCWSS)STORAGE0100 000200 000300 000400 000500 000600 000700 000800 000900 0001 000 0001357911131517192123252729313335373941 434547495153 Volume Stored (million litres)WEEK NO20172018201920202021202202040608010012 0 Feb-08 Feb-09 Feb-10 Feb-11 Feb-12 Feb-13 Feb-14 Feb-15 Feb-16 Feb-17 Feb-18 Feb-19 Feb-20 Feb-21 Feb-22 Feb-23 Feb-24 Percentage Full (%)Water Stored in Minor DamsOverall Percentage August 2022 Previous week2021202020192018 ALEXANDRA (Table Mountain) VILLIERS (Table Mountain) (Table Mountain) (Simon's Town)1 (Helderberg) GAY (Simon's Town) (Table Mountain) (Table Mountain) Stored4 Dam Storage and Water Use TrackingMINOR DAMSSTORAGE0%10%20%30%40%50%60%70%80%90% 100%010020030040050060070080090001-Nov-2 101-Jan-2201-Mar-2201-May-2201-Jul-2201- Sep-2201-Nov-22 Gross storage of major dams (%)Gross storage of major dams (million m )
2 Actual Dam LevelsProjection of storage based on all users using their full allocationsCRITICALZONEEMERGENCY RESPONSE ZONEW ater difficult to abstract from dams (10%)DANGER ZONE05010015020025030035040001-Nov-2101- Dec-2101-Jan-2201-Feb-2201-Mar-2201-Apr- 2201-May-2201-Jun-2201-Jul-2201-Aug-2201 -Sep-2201-Oct-22 Cumulative Weekly Usage (million m3)Target (MCM)Actual (MCM)Planned (MCM)025507510012515017520022501-Nov-210 1-Dec-2101-Jan-2201-Feb-2201-Mar-2201-Ap r-2201-May-2201-Jun-2201-Jul-2201-Aug-22 01-Sep-2201-Oct-22 Cumulative Weekly Usage (million m3)Target (MCM)Cum Actual MCMP lanned (MCM)AgricultureCoCTRainfall RecordedAccumulated Monthly Rainfall at WemmershoekNote: Wemmershoek station used due to long record and mountainous (mm)2021/20222020/20212019/20202018/2019 2017/2018 Long Term AverageTotal*LT AverageBlackheath Mountain (Woodhead) AugNotes: *Total/cummulative rainfall for month indicated aboveLT: Long TermRAINFALL (mm)01-Aug02-Aug03-Aug04-AugDrinking Water QualityNotes:This table shows CCT drinking water quality compliance according to the South African National Standard 241:2015.
3 Compliance, measured against all prescribed chemical and microbiological components, consistently exceeds the very high CCT target of 98%. (Overall compliance percentages of continuous sampling and analysis are released on a monthly basis. Quality Compliance (%)Target (%) PASS RATE)
