Transcription of A clean start is essential - filter selector
1 A clean start is essentialCleanliness ServicesProfitability starts with clean componentsParker Cleanliness ServicesModern equipment calls for profitable and reliable operation. In general more attention is given to the system cleanliness level once the machine or installation is assembled. The fluid cleanliness level is often expressed in accordance to ISO4406:1999 or NAS 1638. Contamination present in new or modified system components have a significant impact on the amount of build-in contamination. This build-in contamination does not only shorten the life time of other system components due to wear and tear processes, it also represents high cost associated with flushing new build, or modified, systems to achieve the required cleanliness level.
2 Parker Filtration supports OEM s and system builders to define and measure the cleanliness level of system components in accordance to ISO 16232 or VDA 19 Parker Cleanliness Services is about Analysis of the component cleanliness level Analysis of hydraulic and lubrication fluids Analysis of filters and filter elementsHow does it work? System component is placed in a cleaned cabinet The component is pressure rinsed with a clean flushing fluid The flushing fluid is collected and filtered using a 5 micron membrane After drying the weight of the contaminated membrane is measured and compared with a clean membrane A microscope scans the membrane, by polarizing the light the unit can discriminate between metallic and non-metallic particles Visual analysis of the membrane by microscope is performed A report is generated reporting the cleanliness in accordance to the ISO 16232 or VDA 19 standardManufacturing and flushing processes of system components can be improved by frequent validation the cleanliness level against ISO ISO 16232 or VDA 19.
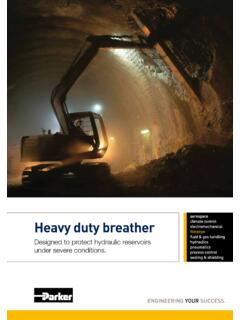
3 Monitoring the development of the cleanliness level supports the capability of the supply of systems components meeting the OEM or system builder cleanliness Filtration in Arnhem, The Netherlands, offers a commercial service to validate the cleanliness level of components. This dedicated unit includes a cabinet with a conditioned environment for optimal analysis of the rinsing of manifold blockPressure rinsing of hydraulic hoseOver 80% of system failure is due to contamination, we introduce a service to analyze the cleanliness level of system componentsAchieving lower cost of manufacturing by introducing control of component's cleanliness levelsThe report includes: The number of metallic particles and corresponding distribution of sized The number of non-metallic particles and corresponding distribution of sized The largest and smallest particle measured Detailed pictures of the contamination Largest fiber measuredCleanliness level control is more than reporting only Following the Lean manufacturing principle of continuous improvement, our cleanliness services provides reports and recommendations that can be used to.
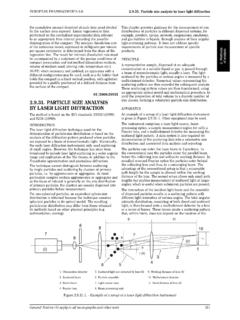
4 Verify the existing cleanliness level of components against international accepted standards Supports initiatives to improve the manufacturing and flushing processes of new components and how it impacts the cleanliness level of system componentsReport in accordance to ISO 16232 : Example of images Prevent future failure of system components by defining target cleanliness levels and frequent validation if these are metallic particle660 m x 229 mSecond largest metallic particle644 m x 177 mLargest nonmetallic particle542 m x 121 mSecond largest nonmetallic particle387 m x 76 mMembrane overviewLargest fiber: L = 2072 mClea nli ne ss Ana lysis accor di ng to ISO 16232 Des crip tion o f sampleComponent: 8-8F42 EDMLOS Date of E xtr acti on: Comp.
5 N o.: 8-8F42 EDMLOS Sample 3 Examine r: loo sterman 3102-21-21 :sisylanA fo etaD 3740R :.oN elpmaS LRS ylatI nifinnaH rekraP :remotsuCExtractio nMe th od : Press ure r insi ng Components o n f ilte r: 1 Liquid: Haku 1025 -920 Comp. S urface [c m ]: 1,2 56 tartiN esolulleC m 5 :epyT retliF l :]L[ tnuomAe f ilte r gm08,4 :]gm[ thgieWMic rosc op ic Analys isScale: X:6 ,3 m/P xl Y:6,3 m/P xl Eval. Diamete r [mm]: 44 La rge st m eta llic pa rticle Len gth [ m]: 66 0 Width [ m]: 22 9 La rge st n on meta llic p arti cle1 Len gth [ m]: 54 2 Width [ m]: 12 1 Len gth o f l arge st f ibe r2 [ m]: 207 2 Tota l l eng th o f f ibe rs2 [m m]: 27 ,48 Parti cle c ount1on m embrane Parti cle c ount1pe r s ample Parti cle c ount1pe r 1 000 c m Parti cle si ze [ m] Cod e Tota l1 Me ta llic Tota l1 Me ta llic Tota l1 Me ta llic Summariz ed r esult s.
6 > 6 00 J-K 333,03,0238 8,5238 8,5 10 0 - 60 0 F-I 42 014 1420 ,0141 ,0 334 394 ,9112 261 ,1 15 - 10 0 C-E 991 3165 2991 3,0165 2,0 789 251 5,9 131 528 6,6 Detaile d res ult s: > 1 00 0 K 000,00,00,00,0 60 0 - 10 00 J 333,03,0238 8,5238 8,5 40 0 - 6 00 I 878,07,0636 9,4 557 3,2 20 0 - 4 00 H 712871 ,028 ,0565 28,7222 93,0 15 0 - 2 00 G 892589 ,025 ,0708 59,9199 04,5 10 0 - 1 50 F 25 281252 ,081 ,0200 636 ,9644 90,4 50 - 1 00 E 125 441 0125 4,0410 ,0 998 407 ,6326 433 ,1 25 - 50 D 405 179 9405 1,0799 ,0 322 531 8,5636 146 ,5 15 - 25 C 460 844 3460 8,0443 ,0 366 878 9,8352 707 ,0 5 - 15 B 143 9427 0143 94,0270 ,0 114 601 91,1214 968 ,2 CCC1 ( Component C le anli ness C od e).
7 A(B24/C -E23 /F -I1 9/J -K12) A(B24/C 22/D 22/E 20 /F 18 /G 17 /H 16/I1 3/J 12 /K00) 1: P articles withou t f ibe rs 2: Definition fibe r: Nonmetallic, Compactness < 30 % or Leng th/Width > 10 . System performance does not rely on luckBest practice for reducing cost of ownershipDepending on the circumstances, up to 80% of system failure is caused due to contamination. For those applications were continuous analysis of the fluid cleanliness level is not implemented, Parker offers extended laboratory services to support quick validation of the hydraulic fluid condition. In addition to this, our analysis provides an indication of the system s fluids are selected based on their unique performance with regard to: Energy transfer Protection against corrosion Cooling Sealing LubricationSystem safety and efficiency are directly influenced by the condition of the hydraulic fluid.
8 Frequent validation of the hydraulic fluid s condition is not always in place by means of standard work procedures, regularly judging the usability of the oil. How can we help?Parker s cleanliness services replaces good luck by best practices and facts. Because safety and reliability should not depend on assumptionsLifetime of hydraulic and lubrication fluids is continuously influenced by the amount of oxygen, oil temperature, water content and presence of catalyser type elements. The effects of static electricity causes additional impact to the fluid s life time. In some occasions various oil types are mixed. With all uncertainties in place about the usability of the oil, introducing best practice for oil analysis is worth to consider!
9 Frequent analysis of the hydraulic fluids enables users of equipment to perform trend analysis. With trend analysis we can avoid system failure and damage to the environment. How to implement Best Practice for system safety and efficiency:By introducing frequent hydraulic fluid analysis, Parker Filtration is able to provide information about: Hydraulic Fluid Cleanliness Level Hydraulic Fluid Water Content Fluid viscosity and viscosity index Chemical compositionFast turnaround: Test results are provided within 72 hours after receiving your fluid sample on regular working days. For Spectro-chemical analysis detailed report is provided within 7 provides fluid sample kits including the pre-cleaned and sealed sample bottle.
10 This bottle is supplied with a reusable mailing container with pre-adressed label. Information about how to take a hydraulic fluid sample is Parker sample kit allows the end user to select the desired analysis package. For every fluid analysis made by Parker, a complete report is provided by e-mail including information about: Cleanliness level expressed in ISO, NAS and SAE AS4059 Rev. D code Water content expressed in ppm Viscosity at 40 C and 100 C and viscosity index TAN (total acid number) Spectrochemical analysis of over 20 wear metals and additives OptionReference codeSample bottle includedScope of analysis 16084000001 YesParticle count/Membrane/Water content/Microscopic photo26084000006 YesParticle count/Membrane/Spectro-chemical/Water content/Microscopic photoOptionReference codeSample bottle includedScope of supplyA6084000000 YesEmpty bottle kitCountryE-mailPhoneThe 541 585 213 140 450 258 672 809 435 60 024 51 902 330 262 223 501-0 Czech 284 083 111 Parker 263 760 376 Oil analysis packagesOil analysis packagesThe analysis of used filter elements is beneficial to tailor the performance of the filter in accordance to the system filter elements can