Transcription of A comprehensive QA-QC framework
1 Copyright 2012 Omega Geo-Consulting Pty Ltd PO Box 7646 - Cloisters Square - WA 6850 - Australia - +61 8 9367 8770 - - February 2012 OMEGA Geo-Consulting Pty Ltd A comprehensive QA-QC framework A project was conducted to design a QA-QC framework that enables the close monitoring of data quality throughout all the stages of a drilling campaign. The view was taken that a drilling campaign can be broken down into 6 linked processes P1 to P6. A process delivers an output that becomes the input into the next process (Figure 1). MethodsPersonnelEquipmentMaterialsTask DiagramProcess MapInputsStartOutputsEndyesnoActivityAct ivity MapStartnoyesEndTaskOutputsInputs yes / no decision pointFigure 26 linked ProcessesDrill the holesPrepare drill campaignP1P2 Validate dataP5 Store in databaseP6 Dispatch labCollect labP4P3 Log coreSample coreBag samples Label bags Figure 1 Core DrillingActivity Design of the QA-QC framework The six processes were mapped (Figure 2) following a detailed review of the practices in place.
2 Quality assurance (QA) standards were then developed and included the definition of measurable critical-to-quality (CTQ) characteristics closely connected to the geologist s quality goals. Operation of the QA-QC framework A check sheet is used to collect the quality control (QC) data (see Table 1). Each process has a specific check sheet targeting inputs, outputs and control factors (methods / personnel / equipment / materials) relevant to the process CTQ s. The field technician records their observations into the check sheet by means of an easy-to-use 1 - 2 - 3 scoring system closely related to the QA standards (see Table 2). A rating on the scale of 1-to-10 is computed based on the actual scores.
3 The rating serves to show how the process performs relative to agreed thresholds and to make the best possible decision regarding the process output(s). On the example of P2: accept the hole as drilled or get it re-drilled. CTQ-Group 1 CTQ-G1 CTQ-Group 2 CTQ-G2 Quality TableEvaluation CTQ-G1 (weight 3)Evaluation CTQ-G2 (weight 5)Accept (1) / Reject (0)Evaluating CTQ-Groups Computing the rating Making a decisionCTQ 1 CTQ 2 CTQ Output 1 Input 1 (CTQ)Process control factor 1 (CTQ)Input 2 (CTQ) CTQ scoresOutput 2 Capturing CTQ scores8106chronological sequence of drill-holesRating [0, 10]AcceptMonitorReject32 Standards are honouredDefects are toleratedDefects are not accepted1 Defects cannot be corrected ANDdata quality is severely compromisedDefects can be corrected ORhave a low impact on data qualityNo defectsQuality specifications are met Table 2 Table 1 Figure 3 Imaginary data only !
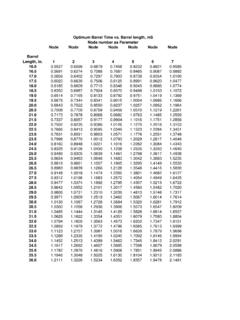
4 Control charts assist in detecting any suspicious variations or trends in process performance, which is an added benefit of the methodology Figure 3 plots the P2 rating as the campaign progresses.