Transcription of A Practical Guide to Getting Started with Propensity ... - SAS
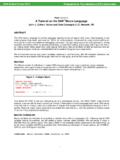
1 1 Paper 689-2017 A Practical Guide to Getting Started with Propensity Scores Thomas Gant, Keith Crowland Data & Information Management Enhancement (DIME) Kaiser Permanente ABSTRACT This paper gives tools to begin using Propensity scoring in SAS to answer research questions involving observational data. It is for both those attendees w ho have never used Propensity scores and those who have a basic understanding of Propensity scores, but are unsure how to begin using them in SAS. It provides a brief introduction t o t he concept of Propensity scores, and then turns its attention to giving you tips and resources that will help you get Started .
2 The paper walks you through how the code in t he book "Analysis of Observational Health Care Data Using SAS ", which is published by the SAS institute , is used to analyze how a health care treatment impacted an associated health care outcome. It details how Propensity scores are created and how Propensity score matching is used to balance covariates between treated and untreated observations. With this case study in hand, you will feel confident that you have the tools necessary to begin answering some of your own research questions using Propensity scores.
3 A BRIEF INTRODUCTION TO Propensity SCORES A Propensity score is the conditional probability that a subject receives treatment given the subject s observed covariates. The goal of Propensity scoring is to mimic what happens in randomized controlled trials (RCT s) by balancing observed covariates between subjects in control and treatment study groups (Faries, Leon, Haro, Obenchain, 2010). Randomized controlled trials are considered the gold standard when evaluating a treatment s effectiveness. I n a randomized controlled trial, subjects are randomly placed into a treatment and a control group.
4 T he treatment group receives the treatment and the treatment outcomes are evaluated versus the control group outcomes. Due t o randomization, an RCT has n o selection bias when splitting subjects up into t he control and treatment groups. Randomization balances both observed and unobserved characteristics between the two subject groups. Thus it accounts for all possible confounding variables . Confounding variables are independent variables other than the treatment variable that are correlated t o t he outcome of the study. Unaccounted for confounding variables prevent us from measuring the true impact a treatment has on an outcome.
5 Randomized controlled trials can be expensive, resource intensive t o perform, and in certain circumstances unethical to perform. For these reasons, data scientists often rely on observational data. The challenge with observational data is that treatments are not applied randomly, leading to selection bias and confounding variables. For example, if you study the impact of a heart disease medication, and you compare the outcome of all those who receive the medication versus all of those who didn t, you would likely have a huge level of selection bias, as those who receive t he medication are likely to have higher blood pressure, a higher BMI, diabetes, etc.
6 Improved confounding variable balance between treatment and control groups can be achieved by matching observations from each group based on the Propensity score, which i n this case would be the probability that a patient received the medicine given the observed covariates. Propensity score analysis seeks to isolate t he treatment as the only difference between our treatment and control groups. STEPS TO PERFORM A Propensity SCORE ANALSYSIS The purpose of this paper is to give you the tools you need to begin performing Propensity score analyses.
7 It is geared towards hands-on learning. It will take you through each step you need t o carry out a successful analysis using SAS , while highlighting common pitfalls to avoid. As mentioned above, it 2 will borrow heavily from the concepts and code in the first three chapters of Analysis of Observation Health Care Data Using SAS ", published by the SAS institute . To help accomplish this, the paper will walk you through a case study performed at Kaiser Permanente regarding patients who received a treatment and to what degree, if at all, this treatment led to a more adverse outcome.
8 In this case study, the analysis moves through a series of steps which are important to completing a sound analysis. These steps are shown in Figure 1. Figure 1. The recommended steps to take when completing a Propensity score analysis Each of the numbered steps in Figure 1 correspond to the titled sections in the paper that follow. The paper covers all steps, with more emphasis placed on steps 3 through 5, which involve creating Propensity scores, creating treatment and control groups with one to one Propensity score matching, and testing for balance between the treatment and control groups.
9 As you go through model validation, statistical approach peer review, and customer review, adjustments are made to the analysis which require a fresh look at your approach to the question at hand. This review process that occurs in steps 7-9 is vital to have confidence in the final analysis, and multiple runs through the steps above are part of the analytical process. Thorough research of the business problem, along with more experience using Propensity scores, should reduce the number of times you need to go through the steps above before completing your analysis.
10 Note that this paper uses the term customer frequently. In the context of this paper, a customer is the individual requesting the analysis, whether that individual sits within or outside of your organization. STEP 1: IDENTIFY AND UNDERSTAND THE BUSINESS QUESTION Due to the proprietary nature of this analysis, we have generalized our case study and do not detail the specific treatment or outcome measured. This is appropriate as our primary purpose in this paper is to provide a Practical Guide to performing Propensity score analysis, and the details of the case study are not required to accomplish this.
