Transcription of A Tutorial for Chemists: Using Mnova to Process, Analyze ...
1 A Tutorial for Chemists: Using Mnova to Process, Analyze and Report 1D and 2D NMR on Your Desktop Chen Peng, PhD VP of Business Development, US & China Mestrelab Research SL San Diego, CA (858) 736-4563 Version Aug. 2012 Overview of Mestrelab and Mnova Open and process 1D and 2D NMR data Multiplet Analysis for 1D H-1 NMR Assign 1D peaks to a structure Assign 1D and 2D spectra Report analysis results Basic handling of multiple spectra Outline Products and Applications 1D Chemists Specialists Users 2D Arrayed Quick processing, analysis, reporting, structure verification etc. Detailed structure verification, elucidation, assignment, deconvolution, spin simulation, quantitation etc. Batch processing & verification and reporting, relaxation studies, diffusion studies, reaction monitoring, ligand-protein binding screening (FB-drug design), metabolomics studies, Impurity ID etc.
2 Mnova NMR Mnova NMRP redict Desktop LC/MS GC/MS Quick reaction monitoring, molecular verification, elemental composition determination, Reporting, etc. Batch processing, analysis and reporting, quantitation, etc. Mnova MS Mnova DB Creating databases, Storing and searching structures, NMR, LC/GC/MS raw data and analysis results, Texts etc. NMR Mnova Verify Mnova is compatible with Mac, Windows and Linux Spectroscopists Mnova Scripts Mestrelab Research 1996: A research project in University of Santiago de Compostela, Spain, developed free MestReC software for NMR processing 2004: Mestrelab Research incorporated in Santiago de Compostela 2004: New MestreNova ( Mnova ) platform and NMR plugin released 2006: NMRP redict Desktop plugin released with Modgraph 2009: LC/GC/MS plugin released with Sierra Analytics 2009: Global Spectral Deconvolution (GSD) algorithm released with ExtraByte 2011: DB plugin for Database Management 2012: Verify plugin for auto structure verification and peak assignment 2012: qNMR and Screen plugins - to be released An R&D company with >20 people and >80,000 registered users Before you start Make sure Mnova is properly installed and licensed on your computer.
3 If you don t have license, you can download, install and free trial for 45 days*: To verify your licensing status, choose Help > License Manager Host ID (unique for this computer) Location of the license files Make sure you have a positive number or Never (for perpetual license) here Days before your Update and Support package expires** *There is no difference between the free trial version and the released version of Mnova . **If your Update and Support package has expired, you can only run the versions of Mnova that were released before the expiration date. Find previous versions of Mnova at Sample data sets A set of 1D 1H, 13C, 2D HSQC, and LC/MS* raw data of quinine are included when Mnova is installed. So is the .mol file. You can find them in a folder similar to the following: C:\Program Files (x86)\Mestrelab Research \MestReNova\examples\datasets These data are used in many of the examples shown in this Tutorial .
4 When you use your own data, make sure you copy all the files in the folder of an experiment. *You need the Mnova MS license to open and Analyze LC/MS data. See for details. To open and transform your NMR data Choose File | Open to open the fid (or ser) file from the raw data Or drag an fid file from a file browser to Mnova * Mnova automatically transforms the raw file into frequency domain (including Windowing function, fourier transform , phase correction etc) ** *You can drag multiple folders that contain fid (or ser) files to Mnova to open multiple spectra simultaneously. **Parameters from the raw data are used for processing. You can control the importing of some parameters (zero filling, phasing, baseline correction etc) by choosing Edit > Preferences > NMR > Import. You can view or change the processing parameters by choosing Processing | Processing Parameters.
5 Drag & drop To see the parameters Choose View | Tables | Parameters to view the acquisition and processing parameters Click Report to report the parameters as a text box on the spectrum. Resize the text box and spectrum to make a better layout Use the green handles to move, rotate and resize the text box Click for phase correction if peaks are not symmetric* Click for baseline correction if baseline is not zero * Click to calibrate the chemical shift reference if the solvent or TMS peak is not at the right ppm *Click the arrow next to the tool icon for options. See Help > Contents > Processing Basics for more details To correct phase, baseline & reference Zoom in/Zoom out (or press Z) * Zoom out Full spectrum (or press F) Manual Zoom in to defined ppm range Pan spectrum (or press P)** Expansion click&drag to draw an inset (or press E) Fit to Highest Intensty (or press H) Fit to highest compound peak Increase Intensity (or rotate mouse wheel) Decrease Intensity (or rotate mouse wheel) Crosshair Cursor (or press C) for measuring J-couplings Cut (or press X)
6 To hide parts of the spectrum To visualize your spectrum *Press Z several times to toggle between horizontal/vertical/box zoom ** Press P several times to toggle between free/horizontal/vertical panning Click E, then click and drag to define the range for the inset To change the display properties Right click on a spectrum and choose Properties from the context menu A lot of display properties can be customized You can click Set as Default to save the settings for spectra opened in the future You can save the settings for other users Using the Save Properties and Load Properties tools Tip: Use options in the Geometry Tab to change the size of a spectrum precisely To display 2D spectra in the way you want Use the Plot Mode tools to change to bitmap or contour display etc. You can also change other display properties by right-clicking on the spectrum and then choose Properties: Legend Color Palette: You can define your own Contours: numbers and scaling, and line width Traces: method and space Tip: You can set a line width for 2D contours independent of that for 1D curves since To attach 1D to 2D spectra Open 1D and 2D spectra in the same document (They are shown as separate pages) Display the 2D spectrum, click the Traces tool options and choose Choose a 1D in the Available 1D Spectrum, click to attach it to that axis To change the Y intensity of the trace: Place the cursor on the trace and scroll the mouse wheel, or click Ctrl+Shift+arrow keys.
7 To move the baseline of a trace: Shift + mouse wheel. To Analyze and report multiplets of H-1 NMR Mnova provides two approaches to multiplet analysis: Fully automatic: peak picking, integration and multiplet analysis all done by one click, with peaks deconvolved Using GSD* and types classified Manual: click-and-drag to pick each multiplet interactively In either case you can refine the results interactively, and report them in selected journal or patent formats *GSD (Global Spectral Deconvolution): See Help > Contents > Analysis tools > Peak Picking > GSD for details Alert to users of Version 6 or older: Adopt the new workflows for more efficient multiplet analysis There have been major changes to the peak picking, integration and multiplet analysis since Version 7, including GSD, auto peak classification, and more intelligent multiplet analysis.
8 If your goal is to extract multiplet information (chemical shifts, integrals and J-couplings), use the Automatic Multiplet Analysis tool or the Manual Multiplet Analysis tool to extract such info directly. Do NOT integrate peaks prior to it. If you did manual or auto integration prior to multiplet analysis, such integrals will be replaced by the multiplet integrals. Integrals from either operations are independent, and may be different due to different integration mechanisms and options. You are recommended to use the Automatic Multiplet Analysis or Manual Multiplet Analysis directly without a priori peak picking or integration Pick picking and classification, integration, and multiplet analysis are all done in one step: Fully automatic multiplet analysis Click to do automatic multiplet analysis. By default, it does the following: Picks peaks Using GSD (if no peaks were picked) and classify their types (compound, solvent, impurity peaks etc.)
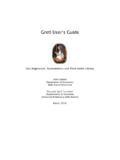
9 Note these are controlled by the Peak Picking options Groups the picked peaks into multiplets and fits them to J-coupling patterns, and calculates their integrals (depending on the Multiplet Analysis options). Note these are controlled by the Multiplet Analysis Options Estimates the total number of nuclides (NN) and normalizes the integrals for each multiplet Total # of nuclides from all the multiplets and the # of protons in the molecule (if present) The number of nuclides (NN) of the multiplet Normalized integral of the multiplet. *GSD (Global Spectral Deconvolution): See Help > Contents > Analysis tools > Peak Picking > GSD for details Advantages of GSD-based multiplet analysis GSD extracts the spectral information from a H-1 spectrum fully automatically without the need for peak picking threshold and integration regions. It usually gives good results when the spectrum is of decent quality and resolution, as shown by the examples here: The GSD-based multiplet analysis gives more accurate J-coupling constant ( Hz) than the apparent peak separation ( ) The GSD-based multiplet analysis successfully recognizes and separates the triplet from the large HDO peak The GSD-based multiplet analysis successfully recognizes a very complex (dddd) multiplet.
10 Red: experimental spectrum; Blue: GSD peaks; Purple: simulated multiplet Tip: To display the GSD peak curves (and sum or residuals), expand the Peak Picking Tool menu , and check Show Peak Curves or other options. You can also use the Properties dialog To pick multiplets manually Manual Multiplet Analysis allows you to have more control of the multiplet analysis (J is the shortcut key) You zoom into each multiplet, click and drag to define the following: Peak picking threshold Integration region* Mnova picks the peaks in the region, fits them to a J-coupling pattern and defines the multiplet in the same way as in automatic multiplet analysis Click and drag to define the integration region and peak picking threshold and a doublet will be picked Tip: To turn on the integral curves, right click and select Properties, go to Multiplets > Integrals.