Transcription of AA-2000 ZOOM RigExpert
1 AA-2000 ZOOMRigExpert User s manualAntenna and cable analyzersFor latest manuals and software updates, please the AA-2000 ZOOMF irst time useMain menuMultifunctional keysConnecting to your antennaSWR chartChart ZOOMData screenFrequency and range entryReturn loss chartR,X chartSmith chartMemory operationSWR meter, SWR2 AirDisplay all parametersMultiSWR modeMultiband modeHOLD functionsFrequency generatorMy Bands ApplicationsAntennasCoaxial linesMeasurement of other elementsAnnexesAnnex 1: SpecificationsAnnex 2: PrecautionsAnnex 3: Tools menuTable of contentsAnnex 4: Setup menuAnnex 5: TDR mode Annex 6: CalibrationAnnex 7: Dummy loads DECLARATION OF CONFORMITY3435394142 RigExpert AA-2000 ZOOMT hank you for purchasing a RigExpert AA-2000 ZOOM Antenna and Cable Analyzer!
2 We did our best to make it powerful yet easy to analyzer is designed for measuring SWR ( standing wave ratio), return loss, cable loss, as well as other parameters of cable and antenna systems in the range of 100 kHz to 2000 MHz. A built-in ZOOM capability makes graphical measurements especially effective. An integrated Time Domain Reflectometer mode can be used to locate a fault within the feedline system. The analyzer is equipped with a Bluetooth Low Energy module for a wireless connection with your laptop, tablet or smartphone. The following tasks are easily accomplished by using this analyzer: Rapid check-out of an antenna Tuning an antenna to resonance Comparing characteristics of an antenna before and after specific event (rain, hurricane, etc.)
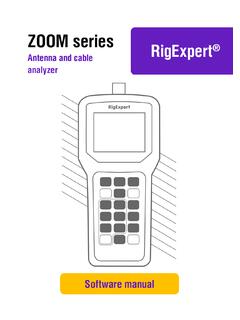
3 Making coaxial stubs or measuring their parameters Cable testing and fault location, measuring cable loss and characteristic impedance Measuring capacitance or inductance of reactive loads1. Antenna connector2. Color display3. Keypad4. USB connector5 Introduction1234 User s manualMain menuThe Main menu acts as a starting point from where different tasks may be (Cursor up) and (Cursor down) keys to scroll through the menu, then press (OK) to select an your convenience, a battery indicator is shown at the top-left corner of the screen. This indicator is replaced with a USB icon when the analyzer is connected to your analyzer will be turned off automatically if not in use for too long.
4 First time use Please insert three AA sized batteries (alkaline , Ni-MH or LiPO accumulators) into the battery compartment of the analyzer, watching the polarity. Press the (Power) key located at the bottom-right corner of the keypad to turn on the analyzer. After displaying the initial message (showing a firmware version and a serial number of the instrument), a Main menu appears on the may use hot keys for the quick access to certain tasks. For instance, press the (SWR chart) button to open the SWR chart screen the AA-2000 ZOOMRigExpert AA-2000 ZOOMM ultifunctional keysMost keys on the analyzer s keypad perform several instance, numbers (1) are used to enter frequency and other numerical parameters.
5 Main functions (2) provide quick access to most common tasks. Alternative functions (3) are executed if the user holds the (Functional) key. For the convenience, alternative functions are marked with may press the (Help) key to open a help screen listing all active hot to your antennaPlug the cable to your analyzer s antenna connector, and then tighten the rotating sleeve. The rest of the connector, as well as the cable, should remain stationary. If you twist other parts of the connector when tightening or loosening, damage may easily occur. Twisting is not allowed by design of the s manualChart ZOOMUse the arrow keys to increase or decrease the center frequency or the scanning range.
6 Watch the chart zooming in or out, or changing its position. Use the (Functional key) and (Cursor up) or (Cursor down) key combination to zoom the vertical scale of the chartOnce your antenna is connected to the analyzer, it is time to measure its characteristics. Press the (SWR chart) key to open the SWR chart screen, then press (OK) to start a new few moments later, the result will be displayed on the analyzer s the + key combination to run a continuous small triangle at the bottom of the chart corresponds to a point at which the SWR reaches its not forget to press the (OK) key for the new measurement to (Functional key) and to quickly choose a radio amateur AA-2000 ZOOMData screen The data screen is available in all chart modes.
7 Press the (Data) key to display various parameters of a load at range entry To enter the center frequency or the sweep range, press the (Frequency, Range) cursor keys to navigate, or the to keys to enter values, press the (OK) key to apply. Hold key for band selection, use navigation keys for choosing bandplan, amateur regional bandplan and custom bandplans are available (if they were defined), use keys to apply band loss chartThe return loss (RL) chart, which is very similar to the SWR chart, is activated by pressing the (Functional key) and (RL chart) key combination in the Main s manualR,X chart Press the (R,X chart) key in the Main menu to access the R,X chart values of reactance (X)
8 Correspond to inductive load, while negative values correspond to capacitive chart will display R and X for series or parallel models of a load. Press (Functional key) and to switch between these chart The (Smith chart) key opens a screen where the reflection coefficient is plotted on the Smith a list of hot keys, press the (Help) key, as small marker is used to indicate the center marker at the bottom of the screen shows a resonant frequency closest to the center of the AA-2000 ZOOMM emory operationDevice has 250 unified slots for storing your records. Record operations are linked to relevant data screens - SWR, RX, RL, Smith charts mark their records with Z slot identificator, TDR chart marks with T , , or and respectively for Load, Save or Edit Name operations in relevant data meter, mode allows to measure SWR at one frequency.
9 Mode provides analog meter or historical trend view and has SWR2 Air possibility. Change frequency with , buttons. Press key to start or stop the measurement, + starts measurement with SWR2 Air allows to manifest measured values by speaker or radio(air), using the same measured antenna. Measuring is coded in Morse code, values in range come as two digit word without dot, values and above are represented as long dash. Portable, FM -able radio is typically used to pick up radio channel. Change transmit frequency by pressing + , other SWR2 Air related parameters you can find in Setup menu. Use and to switch between meter and trend view.
10 11 User s manualDisplay all parametersTo display various parameters of a load on a single screen, press the (All) key. Do not be confused by negative values of L or C. This can be useful for experienced screen displays values for series as well as parallel models of impedance of a In the series model, impedance is expressed as resistance and reactance connected in series: In the parallel model, impedance is expressed as resistance and reactance connected in parallel:RXZ = R + jXRXZ = R ||+ jXRigExpert AA-2000 ZOOMM ultiSWR modePress the (Functional key) and (Multi) key combination to see the SWR at up to five different frequencies.
