Transcription of ABC Classification for Inventory Optimization - …
1 IOSR Journal of Business and Management (IOSR-JBM) e-ISSN: 2278-487X, p-ISSN: 2319-7668. Volume 15, Issue 1 (Nov. - Dec. 2013), PP 38-41 38 | Page ABC Classification for Inventory Optimization Dinesh Dhoka1, Choudary2 1(Research Scholar, SRM University, Chennai, India) 2(Asst. Professor, Research Guide, Commerce, Govt. Arts College for Men, Chennai India) Abstract : Inventory Classification is very important to manage Inventory efficiently. Popular concept - Importance and Exception (CIE) is employed to ensure that efficiency is maximized with least effort .For Inventory Optimization and Inventory Forecasting, products need to be classified appropriately.
2 There are several methods used for categorization of products and items in Inventory . Most common Classification used is the Pareto Analysis. The focus of this paper is to check if some assumptions for ABC Analysis are taken for granted. Keywords: ABC- Analysis, Inventory Optimization , Inventory Planning I. INTRODUCTION In any industry today Inventory Optimization is such a vital function. Excess and Shortage of Inventory in all levels of the supply chain can affect the availability of products and/or services to consumers. Several monitoring systems and processes can be employed to check Inventory imbalances to minimize the supply and demand dynamics. To simply these monitoring systems and process items/materials/products are classified into different groups [1].
3 Also it is easier to monitor and control vast systems through the Concept of Importance and Exception (CIE). Several different strategies need to be applied appropriately for Integrating Inventory Classification and Policy Selection [2] so that it benefits the entire Supply Chain and not only individual entities of the Supply Chain . Several such categorization of items / materials / products are based on 1. Price 2. Value 3. Criticality 4. Availability 5. Movement 6. Predictability 7. Weight ABC Analysis is based on Pareto Analysis [3] which says 20% of the items contribute to 80% of sales. It implies that a small portion of items in Inventory contribute to maximum sales. Typically less than 20% of items classified as A, contribute as much as 80% of the revenue.
4 The next 15% (80% - 95%) contribution to revenue is done by B class Items. The last 5 % revenue is generated by items classified as C . As the Classification is done according to the importance of their relative value, this approach is also known as Proportional Value Analysis (PVA). Therefore it is a general trend in the industry to focus more on A class items (approx 20%) which results in maximum revenue (80%). In simple terms, planning and forecasting for A class items can yield maximum benefits II. IMPORTANCE AND NEED There are so many types of products Classification and categorizations available for Inventory Optimization like ABC, XYZ, FSN, SDE, VED, HML etc.
5 ABC analysis can be used for different purposes. Therefore one must carefully study the requirements before any of these categorizations are applied [4]. There are lots of assumptions for each categorization. ABC Classification has an important assumption which is 80-20 rule. Another assumption is the planning horizon. There are no industry standards that define the Period of Analysis and this are randomly decided based on convenience. III. OBSERVATIONS: PERIOD OF ANALYSIS Data from an OEM Company dealing in Automotive Plastics is considered for this Study. This company has 330 Finished-Goods items and their sales data is analyzed. The period of analysis has a large impact on ABC analysis.
6 The table below (Table1) shows data with different periods of analysis. The first row shows data for 1 Month period with 67 active items with number of As, Bs and Cs. When the analysis in increased to 2-Months Period (August 12 to Sep 12) the number of active items increases to 103 (54% increase) Abc Classification For Inventory Optimization 39 | Page and proportionally As, Bs and Cs also increase. Similarly when this analysis is done for 12-Months the number of active items increases to 216 (Almost 3 times). This has a proportional effect on number of items classified as A, B and C. Table 1- % Difference for different Periods of Analysis S no Period Of Analysis Period Active Items % Difference A B C 1 1 Month Sep-12 67 5 13 60 2 2 Months Aug12-Sep12 103 54% 7 16 96 3 3 Months Jul12-Sep12 131 27% 10 22 98 4 4 Months Jun12-Sep12 143 9% 10 26 119 5 5 Months May12-Sep12 161 13% 10 26 133 6 6 Months Apr12-Sep12 171 6% 11 27 136 7 7 Months Mar12-Sep12 175 2% 12 28 149 8 8 Months Feb12-Sep12 187 7% 13 29 155 9 9 Months Jan12-Sep12 190 2% 13 29 157 10 12 Months Oct11-Sep12 216 14% 14 30 173 As per the above table the minimum percentage difference is seen for 6 months to 9 Months.
7 How do we conclude what is the most optimum period for which ABC analysis should be done. The data above has been studied for September 2012. For the subsequent months items may jump from one Classification to another like A to B or B to C etc. Some products may even become inactive. Some new products may also introduced and get classified as A, B or C. These jump/shift from one category to another are quantified using the following steps. This quantitative assessment [5], [6] may help to improvise the application of ABC Classifications Table 2 - for Quantification ABC A is replaced by 1 B is replaced by 2 C is replaced by 3 Inactive is replaced by 4 1.
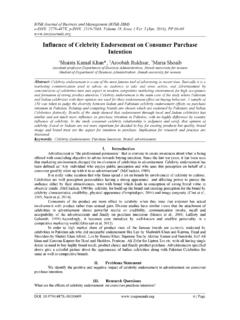
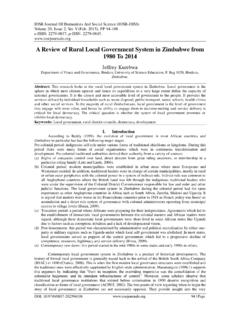
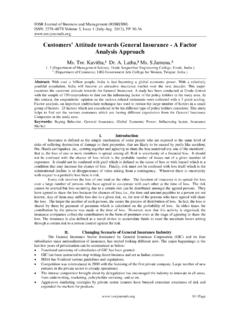
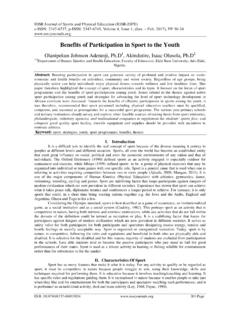
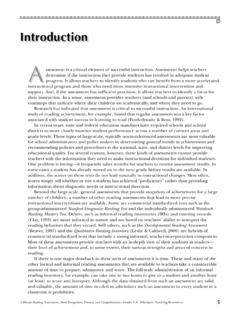
8 This numeric number is compared with the previous period 2. Difference are Squared. 3. The sum of the Squared Difference in ABC is the total variation. Let s take the following examples for a specific item when the Classification changes from A to C Table 3 Steps for Quantifying Variations Example Planning Period 1 Planning Period 2 A C Step 1 Data Reading 1 3 Step 2 Diff in Categorization (1-3) = -2 Step 3 Square of Difference (-2)2 = 4 Step 4 Variations 4 1-Month ABC Classification for successive period is shown in . Abc Classification For Inventory Optimization 40 | Page Figure-1 2-Months ABC Classification for successive periods Figure-2 Using the steps mentioned above the deviations (Movement of Products into different categories of ABC) are quantified and shown below.
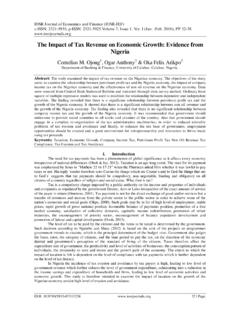
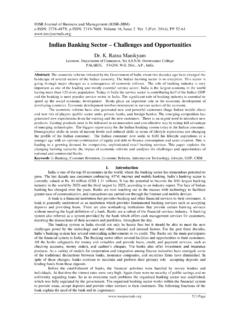
9 In order to ensure that the comparison is done correctly, all Periods of analysis have the same ending period. In the below table Fig. 3 , Column B indicates all periods ending with September 2012. Similarly column D and F indicates all periods ending with October 2012. The deviations observed for 1 Month analysis is maximum. Whereas minimum deviation is observed when analysis is done for longer periods like 6 9 Months Figure-3 Abc Classification For Inventory Optimization 41 | Page IV. CONCLUSION Before ABC analysis is done, the need for the analysis has to be studied. For any kind of Sales Forecasting and Planning if ABC Analysis is not done properly, it may lead to serious Inventory management issues.
10 If ABC analysis for 1-Month data is used, 5 A Category products would have been extrapolated for planning purpose leading to serious shortages of critical items resulting is loss of revenue. Similarly if 12-Month data is used, 14 A class products would have been extrapolated leading to increase in Inventory resulting is Cash-flow issues. REFERENCES Journal Papers: [1] Mitchell A. Millstein, Liu Yang, Haitao Li, Optimizing ABC Inventory Grouping Decisions, International Journal of Production Economics November 2013. [2] Davood Mohammaditabara, Seyed Hassan Ghodsypoura, Chris O'Brienb, Inventory Control System Design By Integrating Inventory Classification And Policy Selection, International Journal of Production Economics, Volume 140, Issue 2, December 2012, Pages 655 659 [3] Ching-Wu Chu, Gin-Shuh Liang, Chien-Tseng Liao, Controlling Inventory by Combining ABC Analysis and Fuzzy Classifications, Computers & Industrial Engineering.