Transcription of Absa Property Equity Fund
1 Wealth and Investment ManagementAbsa Property Equity FundMinimum disclosure documentMonth ended 31 March 2018 fund detailsIndustry categorySA - Real Estate - GeneralBenchmarkFTSE/JSE SA Listed Property IndexFund launch date14 August 2006 Class A launch Date14 August 2006 Class C1 launch date04 October 2013 fund SizeR BillionJSE codeABPEFund ManagerFayyaz Mottiar , CFAA sset ManagerAbsa Asset Management (Pty) LtdMinimum lump sumR 2000 Minimum MonthlyR 200 Income distributions - cents per unit (cpu)Class AClass C1the 3 months ended 30 Jun 3 months ended 30 Sep 3 months ended 31 Dec 3 months ended 31 Mar declaration31 Mar, 30 Jun, 30 Sep & 31 DecIncome distributions15 Apr, 15 Jul, 15 Oct & 15 JanFees and Cost ratio (VAT incl.)
2 FeesClass AClass C1 Initial Fees:Absa:0%0% Fees: Fee:NoNoCosts (annual, based on period shown)Class AClass C1 For the period to 31-12-2017, from:01/01/201501/01/2015 Total expense ratio (TER) costs (TC) investment charges (TER+TC) refer to Disclosure section on next page for further information on Fees and CostsPerformancePerformance: annualised total returns (%)TermClass ABenchmarkSectorAverageRankClass Yearly returns (%)1 yr ending:Mar'18 Mar'17 Mar'16 Mar'15 Mar'14 Mar'13 Mar'12 Mar'11 Class Average & Rank.
3 Applies to the A refer to Disclosures section on next page for further information on calculation methodologyand source of all performance data content (tables and/or charts) of this MDDFund objectivesThe fund aims to provide investors with income and growth over the medium tolonger term at medium to high risk, predominantly obtained in the South Africanlisted Property marketFund strategyThe majority of its assets will be invested in South African investment markets atall times and will predominantly be invested in securities of a Property equitynature traded on South African exchanges, participatory interests that deriveincome and growth of a Property nature.
4 As well as non- Equity securitiesFund features A specialist fund , ideal for medium to long-term investments Diversification from general Equity shares Aims to provide capital growth over the medium to long term Higher risk than the traditional fixed-interest or income fund Suitable for investors who seek exposure to the JSE-listed Property sectorFund specific risksLiquidity: There may be insufficient buyers or sellers of particular investmentsgiving rise to delays in trading and being able to make settlements from the Fundand/or large fluctuations in the value of the fund which may lead to largerfinancial losses than anticipated.
5 Property : Investments in real estate securitiescan carry the same risks as investing directly in real estate itself. Real estate pricesrise and fall in response to a variety of factors, including local, regional andnational economic and political conditions, interest rates and tax profile and advisable minimum termLowLow-MediumMediumMedium-HighHigh3 Months +6 Months +2 Years +3 Years +5 Years +Risk statisticsClass ASince Inception (14 August 2006)Number of positive months96/139 Highest 1 Year Performance28/02 1 Year Performance30/06 performance (5 years)
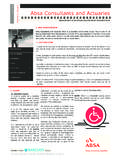
6 Absa Property Equity A FTSE/JSE Listed Property Index50100150200250300 Mar-13 Jun-13 Sep-13 Dec-13 Mar-14 Jun-14 Sep-14 Dec-14 Mar-15 Jun-15 Sep-15 Dec-15 Mar-16 Jun-16 Sep-16 Dec-16 Mar-17 Jun-17 Sep-17 Dec-17 Mar-18 The chart reflects the value (monthly data points) of a R100 investment made on the01/04/2013 Absa Property Equity FundWealth and Investment ManagementAsset Allocation (%)9,97%90,03%Money marketPropertyTop share holding (%)Arrowhead Properties Lim AEquites Property FundFortress Income fund Ltd / LinFortressbGreenbay Prop LtdGrowthpoint PropsMas Real Estate Inc / OrdNEPI Rockcastle PLCR esilientVukileQuarterly fund commentary as at 31 March 2018 The fund Commentary is provided on a quarterly basis and can be found on under Unit Trusts Minimum Disclosure Documents.
7 The latest quarterly commentaryavailable is for the quarter ending 31 March : Class A Adviser annual fee is not included in the annual management fee, it is charged by a way of unit : Total Expense Ratio ( TER ) is expressed as an annualised percentage of the value of the Class of the portfolio that was incurred as expenses relating to the administration of theportfolio. A higher TER does not necessarily imply a poor return, nor does a lower TER imply a good return. The current TER cannot be regarded as an accurate indication of future TER' Costs ( TC ) is expressed as an annualised percentage of the value of the portfolio that was incurred as costs relating to the buying and selling of the assets underlying theportfolio.
8 TC are a necessary cost in administering the portfolio and impact returns. TC should not be considered in isolation as returns may be impacted by many other factors over timeincluding market returns, the type of portfolio, the investment decisions of the investment manager and the TER. Note that the total investment charges (TER+TC) have already been deductedprior to the calculation of the performance figures shown. Effective Annual Cost ( EAC ) is a measure that summarises the total cost that an investor incurs through their investment in aparticular financial product, based on the principles set out in the ASISA EAC standard.
9 EAC data is available on : Performance is calculated for the portfolio class of portfolios. Illustrative performance information is included for illustrative purposes only; individual investor performance maydiffer as a result of initial and ongoing fees, the actual investment date, the date of reinvestment and dividend withholding tax. All figures quoted are from Morningstar and or IRESS, for theperiod ending 31/03/2018 (unless otherwise stated), calculated on a NAV to NAV basis, with income distributions reinvested on the ex-dividend date.
10 Annualised figures refer to the averageyearly return of an investment over a given time period, all actual annual figures (if not shown) are available on Investment Schemes (CIS) are generally medium to long-term investments. The value of participatory interests may go down as well as up and past performance is not necessarilya guide to future performance. Fluctuations or movements in exchange rates may cause the value of underlying international investments in a fund to move up or down. Forward pricing isused. CIS are traded at ruling prices.