Transcription of Absorption by atmospheric gases in the IR, visible and UV ...
1 1 Lecture 6. Absorption by atmospheric gases in the IR, visible and UV spectral regions. Objectives: 1. Gaseous Absorption in thermal IR. 2. Gaseous Absorption in the visible and near infrared. 3. Gaseous Absorption in UV. 4. Spectroscopic databases: HITRAN Required reading: L02: , Additional reading: Rothman et al., The HITRAN 2008 molecular spectroscopic database. Journal of Quantitative Spectroscopy and Radiative Transfer, V100, 533-572, 2009. High resolution spectral modeling 1. Gaseous Absorption in the thermal IR. Main atmospheric gases absorbing/emitting in the IR: CO2, H2O, O3, CH4, N2O, CFCs.
2 9 Each atmospheric gas has a specific Absorption /emission spectrum its own spectral signature. 9 Position of Absorption line centers differs for isotopes of the same molecule. Table Main vibrational transition of water vapor isotopes. Gas v1, cm-1 v2, cm-1 v3, cm-1 H216O H217O H218O HD16O D216O
3 29 Continuum Absorption by water vapor is defined as any observed Absorption by water vapor not attributable to the Lorentz line contribution within 25 cm-1 of each line. It has been suggested that it results from the accumulated Absorption of the distant wings of lines in the far infrared. This Absorption is caused by collision broadening between H2O molecules (called self-broadening) and between H2O and non-absorbing molecules (N2) (called foreign broadening). The most recent work suggested that the large portion of the continuum might be due to collision-induced transitions and does not relate to the line wings.
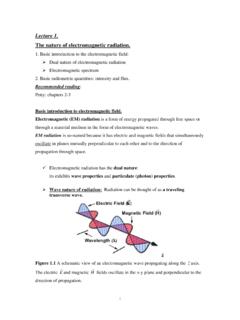
4 9 atmospheric pressure strongly affects the Absorption spectra of gases (through pressure broadening). This poses a major problem in computing the transfer of IR radiation through the atmosphere with varying pressure, temperature, and amount of gases . Figure Example of high spectral resolution transmission spectra of a one-meter path with typical CO2 concentration at 1000 mb and 100 mb. 3 Table The most important vibrational and rotational transitions for H20, CO2, O3, CH4, N2O, and CFCs. Gas Center (cm-1) ( ( m)) Transition Band interval (cm-1) H2O - ( ) continuum* pure rotational 2; P, R far wings of the strong lines; water vapor dimmers (H2O)2 0-1000 640-2800 200-1200 CO2 667 (15) 961 ( ) ( ) 2349 ( ) 2; P, R, Q overtone and combination 3; P, R overtone and combination 540-800 850-1250 2100-2400 O3 1110 ( ) 1043 ( ) 705 ( ) 1; P, R 3; P, R 2.
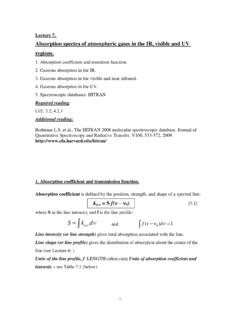
5 P, R 950-1200 600-800 600-800 CH4 ( ) 4 950-1650 N2O ( ) ( ) ( ) 1 2 3 1200-1350 520-660 2120-2270 CFCs 700-1300 NOTE: Chlorofluorocarbons (CFCs) are a family of chemical compounds. 4 Figure Low-resolution infrared Absorption spectra of the major atmospheric gases . (compare to Figure that shows transmission with higher spectral resolution) All gases 5 Figure Transmission spectra of the major atmospheric gases . 62. Gaseous Absorption in the visible and near-IR.
6 9 Absorption of visible and near IR radiation in the gaseous atmosphere is primarily due to H2O, O3, and CO2. Table Main visible and near-IR Absorption bands of atmospheric gases Gas Center (cm-1) ( ( m)) Band interval (cm-1) H2O 3703 ( ) 5348 ( ) 7246 ( ) 9090 ( ) 10638 ( ) 12195 ( ) 13888 ( ) visible 2500-4500 4800-6200 6400-7600 8200-9400 10100-11300 11700-12700 13400-14600 15000-22600 CO2 2526 ( ) 3703 ( ) 5000 ( ) 6250 ( ) 7143 ( ) 2000-2400 3400-3850 4700-5200 6100-6450 6850-7000 O3 2110 ( ) 3030 ( ) visible 2000-2300 3000-3100 10600-22600 O2 6329 ( ) 7874 ( ) 9433 ( ) 13158 ( ) 14493 ( ) 15873 ( )
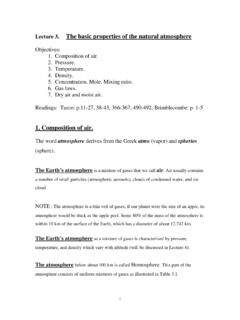
7 6300-6350 7700-8050 9350-9400 12850-13200 14300-14600 14750-15900 N2O 2222 ( ) 2463 ( ) 3484 ( ) 2100-2300 2100-2800 3300-3500 CH4 3030 ( ) 4420 ( ) 6005 ( ) 2500-3200 4000-4600 5850-6100 CO 2141 ( ) 4273 ( ) 2000-2300 4150-4350 NO2 visible 14400-50000 7 Figure Solar spectral irradiance (flux) at the top of the atmosphere and at the surface. NOTE: atmospheric gases absorb only a small fraction of visible radiation. 83. Gaseous Absorption in the UV. Table Wavelengths of Absorption in the solar spectrum (UV + visible ) by several atmospheric gases Gas Absorption wavelengths ( m)
8 N2 < O2 < O3 H2O < H2O2 hydrogen peroxide < NO2 nitrogen oxide < * N2O < NO3 nitrate radical HONO nitrous acid < HNO3 nitric acid < CH3Br methyl bromide < CFCl3 (CFC11) < HCHO formaldehyde * NO2 absorb at < m, but photodissociate at < m NOTE.
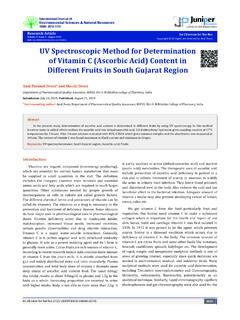
9 To avoid very complicated calculations of electronic transitions, numerous measurements of the Absorption cross-sections of the atmospheric atoms and molecules absorbing in the UV and visible have been performed in laboratory experiments. In general, the Absorption cross section varies with temperature. 99 Absorption of UV radiation in the gaseous atmosphere is primarily due molecular oxygen O2 and ozone O3. Figure Spectral Absorption cross-sections of O2 and O3 NOTE: a) Bands of O2 and O3 at wavelengths < 1 m are electronic transitions. b) These Absorption bands are relatively uncomplicated continua because practically all Absorption results in dissociation of the molecule (so the upper state is not quantized); c) Despite the small amount of O3, no solar radiation penetrates to the lower atmosphere at wavelengths < 310 nm (because of large Absorption cross-sections of O3); Thermosphere /Mesosphere Stratosphere Troposphere 104.
10 Spectroscopic database HITRAN (HIgh-resolution TRAN smission molecular Absorption database) 9 The database is a long-running project started by the Air Force Cambridge Research Laboratories (AFCRL) in the late 1960's in response to the need for detailed knowledge of the infrared properties of the atmosphere. 9 Free to users, need to order and install a free software package HAWKS (HITRAN atmospheric Workstation) 9 The current HITRAN'2008 Database (Version ) contains 2,713,968 spectral lines for 39 different molecules. 9 In addition to the line HITRAN2008 database, there are directories containing files of aerosol indices of refraction, UV line-by-line and Absorption cross-section parameters, and more extensive IR Absorption cross-sections HITRAN Tree structure