Transcription of Experiment # 11: Spectroscopic determination of …
1 57 Experiment # 11: Spectroscopic determination of indicator pKa pH indicators may be defined as highly colored Bronsted-Lowry acid-base conjugate pairs. Used in low concentrations, these compounds signal pH changes within a specific range determined by the particular indicator in use. This color change range depends upon the relative acid strength (or pKa ) of the conjugate acid form of the indicator . In many indicator systems, both conjugate species are colored, and, within the pH transition range, the observed color is really a mixture of the colors of the two forms. The ratio of concentrations of the conjugate acid and base forms is controlled by the pH of the solution, as indicated by the same equation as that used for determining buffer pH s, namely, the Henderson-Hasselbalch equation: _a[conjugate base][Ind ]log log = pH - pK[conjugate acid][] = HInd where HInd and Ind represent the acidic and anionic (or basic) forms of the indicator , respectively.
2 The indicator concentration ratio is controlled by the pH of the solution, whereas the buffer concentration ratio controls the solution pH. At first glance, this statement seems contradictory. In reality, however, it is simply a matter of relative concentrations. The buffer components are present in high concentrations, so they control the pH of the buffer solution via the conventional acid-base reactions. On the other hand, the indicator species are present in low, even negligible, amounts relative to the other acid-base systems in the solution. In terms of visible absorption, however, the indicator species predominate over the buffer components (most of which are colorless). Procedures for determining solution pH using a short range of visual comparisons of indicator colors can usually distinguish pH unit differences over a pH range of units.
3 This analytical approach is improved if a Spectroscopic instrument is used to accurately measure absorbance of one or both of the indicator forms. To adequately interpret such data, knowledge of the value of the indicator pKa is essential. In the present experimental procedure, previously obtained knowledge of the acetate buffer system and the Henderson-Hasselbalch equation will be used to determine pKa values of various indicators. As in the earlier buffer Experiment , standard solutions of M acetic acid and M sodium acetate will be mixed to produce buffer solutions of various pH s. This time, however, the buffer pH will be calculated from the Henderson-Hasselbalch equation, using the previously determined pKa value for the acetic acid-acetate ion system.
4 An additional modification of the procedure is that a constant total concentration of indicator will be added to each buffer mixture. This operation involves the most critical measurement of the Experiment ; unless equal total amounts of indicator are present in all buffers, the Spectroscopic measurements will be meaningless. A number of indicators are provided for analysis, as listed in Table I (along with pertinent Spectroscopic information). 58 Table I indicator (concentration) acid form ( max) base form ( max) Bromocresol green (67 mg/l) yellow (453 nm) blue (610 nm) Chlorophenol red (33 mg/l) yellow (433 nm) magenta (575 nm) Bromocresol purple (40 mg/l) yellow (432 nm) purple (590 nm) To simplify calculations, all Spectroscopic measurements will be made at the wavelength of maximum absorbance, max, of the base form of the indicator .
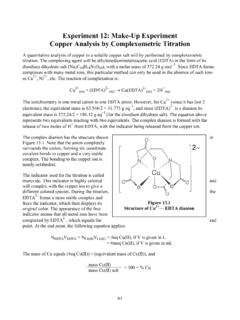
5 Each student (or group of students) will make three determinations of the pKa of one of the indicators, each determination to be made with a different buffer mixture (and buffer pH value). The absorbance of the indicator in unmixed (or pure M) acid solution will be measured to determine the minimum absorbance level of the base form, designated Aa , and the absorbance of indicator in unmixed (or pure M) salt solution is measured as the maximum absorbance of the base form, designated Ab . The Spectroscopic determination of indicator pKa, involves calculations based on the following argument. The total indicator concentration is the same for all buffer mixtures and is proportional to the value (Ab - Aa) if all measurements are made at the max of the base form.
6 In each buffer, the indicator is distributed between two forms, acid and base, the relative amounts of each determined by the buffer solution pH. The concentration of the base form, [Ind ], is proportional to (Ai - Aa) where Ai is the absorbance of the particular buffer sample under study. The indicator acid form concentration, [HIind], is then proportionate to that part of the total amount not in the base form. Thus, the [HInd] is given by the relationship: (Ab - Aa) - (Ai - Aa) = (Ab - Ai). Since the proportionality constant for these concentration relationships is the same, it cancels out when a ratio is made of the concentration terms. Thus, neither total indicator concentration nor any ab term from absorbance values appears in the calculations.
7 The ratio [Ind ]/(HInd] equals the ratio of absorbance terms or (Ai - Aa)/(Ab Ai). The indicator pKa is calculated by substituting the absorbance ratio term (for the ratio of salt/acid) and a theoretical buffer pH value into a modification of the Henderson - Hasselbalch equation, as: iaabi[A - A ]pKpH - log,[A - A ] = Preparation of indicator /buffer mixtures Working in groups of not more than three students, prepare the indicator /buffer mixtures in the familiar manner. Three burets will be involved in the operation: the first contains M acetic acid, the second M sodium acetate, and the third the indicator of choice. Mix the reagents as specified in Table II. Note that mL of indicator is added to each solution (buffer mixtures, pure acid, and pure salt alike).)
8 59 Table II sample # mL Hind mL salt mL acid salt/acid ratio log ratio buffer pH 1 -------- ------- ---- 2 3 4 2 00 5 -------- ------- Calculate the pH of each buffer mixture using the original Henderson-Hasselbalch equation: pH = pKa + log ([salt] / [acid]).
9 The pKa in this equation is for the dissociation of acetic acid as determined in a previous Experiment (it should have a value of about ). Notice that the dilution effect from adding the indicator cancels in the buffer salt/acid ratio. Measurement of indicator /buffer absorbances Turn on a Spectronic 20, and allow the instrument to warm-up. Set the wavelength dial to max for the base form of the indicator chosen for study. Place each of the indicator /buffer solutions in a clean, dry, or properly rinsed cuvette. Use deionized water in a sixth cuvette to calibrate the spectrometer to read 100% T. Record the observed %T (to %) and A for each of the samples in data Table III, and calculate Acalc using the equation: A = 2 - log %T Table III Sample # %T.
10 Ameas Acalc 1 = Aa 2 3 4 5 = Ab Note the designations given to the absorbance values for Samples #1 and #5.