Transcription of ACCELERATE State of DevOps 2019 - Google Search
1 2019 ACCELERATE State of DevOpsSponsored byContentSEXeCUTIVE SUMMARY 3 KEY FINDINGS 5 WHO TOOK THE SURVEY? 7 DEMOGRAPHICS & FIRMoGRAPHICS 8 HOW DO WE COMPARE? 14 HOW To USETHE RESEARCH MODELS 26 HOW DO WE IMPROVe? 29 SDO & organizational performance 30 Productivity 55 HOw DO WE TRANSFORM: What really works? 69 FINAL THOUGHTS 76 METHODOLOGY 77 ACKNOWLEDGEMENTS 79 AUTHORS 80 APPENDIX A: Visual presentation of The Four Key Metrics 81 APPENDIX B: Strategies for Scaling DevOps 82 TABLE OF CONTENTS3 ACCELERATE : State of DevOps 2019 | Executive Summary EXECUTIVE SUMMARYThe ACCELERATE State of DevOps report represents six years of research and data from over 31,000 professionals worldwide.
2 It is the largest and longest-running research of its kind, providing an independent view into the practices and capabilities that drive high performance. The results let us understand the practices that lead to excellence in technology delivery and powerful business research employs rigorous statistical methods to present data-driven insights about the most effective and efficient ways to develop and deliver technology. Cluster analysis allows teams to benchmark against the industry, identifying themselves as low, medium, high, or elite performers at a can then leverage the findings of our predictive analysis to identify the specific capabilities they can use to improve their software delivery performance and ultimately become an elite performer.
3 This year, we also investigate the ways in which organizations can support engineering productivity through 4 ACCELERATE : State of DevOps 2019 | Executive Summary initiatives such as supporting information Search , more usable deployment toolchains, and reducing technical debt through flexible architecture, code maintainability, and viewable systems. Our research continues to show that the industry-standard Four Key Metrics1 of software development and delivery drive organizational performance in technology transformations. This year s report revalidates previous findings that it is possible to optimize for stability without sacrificing speed.
4 We also the identify the capabilities that drive improvement in the Four Key Metrics, including technical practices, cloud adoption, organizational practices (including change approval processes), and culture. For organizations seeking guidance on how to improve, we point to the only real path forward: Start with foundations, and then adopt a continuous improvement mindset by identifying your unique constraint (or set of constraints). Once those constraints no longer hold you back, repeat the process. We also provide guidance on the most effective strategies for enacting these changes. 1 : State of DevOps 2019 | Executive Summary 5 KEY FINDINGS The industry continues to improve, particularly among the elite performers.
5 The proportion of our highest performers has almost tripled, now comprising 20% of all teams. This shows that excellence is possible those that execute on key capabilities see the software quickly, reliably, and safely is at the heart of technology transformation and organizational see continued evidence that software speed, stability, and availability contribute to organizational performance (including profitability, productivity, and customer satisfaction). Our highest performers are twice as likely to meet or exceed their organizational performance goals. 12 ACCELERATE : State of DevOps 2019 | Executive Summary 6 The best strategies for scaling DevOps in organizations focus on structural solutions that build community.
6 High performers favor strategies that create community structures at both low and high levels in the organization, including Communities of Practice and supported Proofs of Concept, likely making them more sustainable and resilient to reorgs and product continues to be a differentiator for elite performers and drives high performance. The use of cloud as defined by NIST Special Publication 800-145 is predictive of software delivery performance and availability. The highest performing teams were 24 times more likely than low performers to execute on all five capabilities of cloud can drive improvements in work/life balance and reductions in burnout, and organizations can make smart investments to support it.
7 To support productivity, organizations can foster a culture of psychological safety and make smart investments in tooling, information Search , and reducing technical debt through flexible, extensible, and viewable s a right way to handle the change approval process, and it leads to improvements in speed and stability and reductions in change approval processes, such as change approval boards, negatively impact speed and stability. In contrast, having a clearly understood process for changes drives speed and stability, as well as reductions in H O TOOKTHE SURVEY?DORA s research provides insight into software development and DevOps practices applied in industry, backed by scientific studies spanning six years with over 31,000 survey responses from working professionals.
8 This year, almost 1,000 individuals from a range of industries around the world added their voices to the 2019 report . Overall, we see similar representation across key demographic and firmographic measures when compared to last year, other than a noticeable drop in the reported percentage of women on With almost 1,000 respondents, our analyses have a 3% margin of error assuming 23 million software professionals worldwide and a 95% confidence : State of DevOps 2019 | Who Took the Survey? 8 Compared to last year, we see consistent representation of respondents across key demographic categories that include gender, disability, and underrepresented groups.
9 While we see similar gender makeup among our survey respondents overall, the reported percentage of women on teams fell compared to last also saw consistent representation across key firmographic categories including company size, industry, and region. The majority of respondents work as engineers or managers within the technology industry. We continue to have diverse representation across departments from consultants, coaches, and sales/marketing roles. Additionally, we continue to see industry representation from highly regulated organizations in financial services, government, healthcare, and retail & FIRMOGRAPHICS 9 ACCELERATE : State of DevOps 2019 | Who Took the Survey?
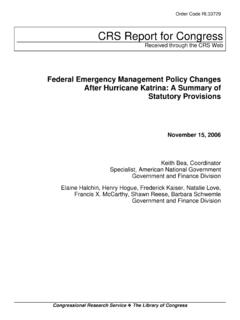
10 3 This is similar to proportions reported by the Stack Overflow Developer Survey 2019, which includes 90% men and 10% women. They do not include non-binary and did not specify. This is consistent with proportions seen elsewhere in industry; , the Stack Overflow Developer Survey 2019, which reports 6% of total respondents identify as having a disability. GENDER DISABILITY MaleNon-BinaryFemaleDid not specifyYesNoDid not specify10+82+1+7+L83% 10% 7% 1% 6+85+9+L85% 6% 9% Gender breakouts from this year s survey responses remain consistent with 83% male in 2019 (vs. 83% last year), 10% female (vs 12% last year), and <1% non-binary (vs <1% last year).