Transcription of ACID-BASE TITRATIONS - Columbia University
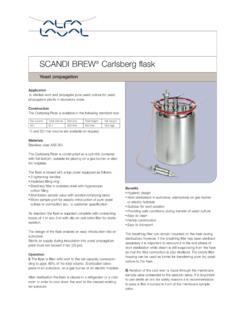
1 1. ACID-BASE TITRATIONS . In this exercise you will use Excel to construct titration curves for a titration between a strong acid and strong base and between a weak acid and strong base . To set up a spreadsheet for the titration between a strong acid and strong base is quite straightforward, and you will use this as a way of getting practice for setting up the spreadsheet for the weak acid strong base titration. At the end of the exercise you should hand in print outs of the plots you created and answers to the questions in each section. A titration curve is a plot of solution pH in a flask vs. volume of titrant (solution in the buret). Figure 1 shows a titration curve for a strong acid strong base , where the acid is in the flask and the base in the buret. As base is added to the acid solution, the pH of the solution in the flask increases slowly at first, then very sharply and then again slowly.
2 The point at which the pH changes dramatically for a very small addition of base is called the end point. 14. 12. 10. 8. pH. 6. 4. 2. 0. 0 volume of base added (L). Figure 1. Titration of A Strong acid with a Strong base Here you will create a spreadsheet which will simulate the titration of L of M HCl (in flask ) vs. M NaOH (in buret). The objective of this exercise is to plot a 2. titration curve (pH of solution in flask vs. volume of NaOH added to flask ) similar to the one shown in figure 1. Looking at the titration curve in figure 1, you can see that before any NaOH is added the solution is highly acidic (since HCl is a strong acid ). As NaOH is added, the acidity of the solution decreases (pH increases). At the end point the pH changes dramatically with very small changes in the volume of NaOH added. Beyond the end point the pH changes slowly with addition of NaOH.
3 Creating the spreadsheet for the titration curve Equations: To calculate the pH of the solution in the flask as the base is added you have to look at what reaction occurs in each region of the titration curve. The titration curve is defined by four regions - (i) before any base is added to the acid solution in the flask , (ii) before the end point (once base is added to the solution in the flask ), (iii) at the end point (iv) beyond the end point. Let's take each region separately. i) Initial conditions (before base added to the acid solution). The flask contains L of M HCl. Since HCl is a strong acid it completely dissociates in solution: HCl H+ + Cl- And so the pH of the solution is determined by the concentration of the H+ ions in solution. pH = -log [H+]. Since the concentration of the acid is M the concentration of the H+ ions in solution is also M and so the pH of the solution is ii) Before the end point Let's start the titration by adding L of base to the acid solution in the flask .
4 The acid in the flask now reacts with the base added. The net ionic equation is: H+ + OH- H2O. Before any base has been added, the number of moles of acid in the flask is x L = moles 3. Adding L of a M solution of base corresponds to adding moles of base . Since the acid completely neutralizes the base this means that the moles of base reacts with moles of acid . Upon adding L of the M base to the acid , the number of moles of acid remaining in the flask is, thus, = moles The pH of the solution is determined by the concentration of the unreacted H+ ions. However, to calculate the concentration of the unreacted H+, you not only need to know the moles of the unreacted H+ ions but also the volume of the solution in the flask . This volume is now L + L = L. So the concentration of the unreacted H+ ions is [H+] = = M.
5 PH = For each increment of base , the pH of the solution can be calculated in a similar way. iii) At the end point The end point is reached when enough base has been added so that all the acid in the flask has been neutralized. This is when the number of moles of base added equals the number of moles of acid initially present. The number of moles of acid initially present is moles, and so, when moles of base have been added, the end point is reached. With M base , moles of base will be added when the volume of the base added to the flask is L. At this point, there is no unreacted acid or base in solution and hence the pH of the solution in the flask at the end point is the pH of neutral water iv) Beyond the end point If more base is added beyond the end point, since all the acid in the flask is reacted, the unreacted base determines the pH of the solution in the flask .
6 NaOH Na+ + OH- The end point is reached when L of base is added. If another L ( a total of L of base ) is added to the flask then it is the moles of base in this L that 4. determines the pH of the solution moles of base . The total volume of solution in the flask is L of acid + L of base = L of solution. The concentration of the unreacted OH- is [OH-] = = M. Hence the pH = pKw + log[OH-]. = 14 + log[ ] = Now with this information you can create a spreadsheet for the strong acid strong base titration curve. However, you have to be careful to use the right equations to calculate the pH depending on which of the above four regions you are in, which in turn depends on how much base has been added to the acid solution. Below are the four equations you will use to create this spreadsheet. Given the information above, you will have to determine which equation should be used in creating the spreadsheet.
7 Remember deciding which equation to use depends on the amount of base that has been added to the solution in the flask . General equations Define: Ca concentration of acid Cb concentration of base Va initial volume of acid Vi total volume of base added at a given point along the titration Va + Vi - Total volume at any point along the titration 1) Initial conditions before any base added pH = -log [Ca]. 2) Before equivalence C a Va C b Vi pH = log( ). Va + Vi 5. 3) At the end point pH = 4) Beyond the end point C b Vi C a Va pH = 14 + log( ). Va + Vi Open the Excel spreadsheet titled stracid_strbase . You will find some entries made in this spreadsheet. Save this file to your floppy disk (File -> SAVE AS. Give the file a name and save to FLOPPY DISK). First note the concentrations of the acid , base and volume of acid have been entered.
8 These values have been defined as constants in the spreadsheet. Ca concentration of acid (M). Va volume of acid (L). Cb concentration of base (M). 1) The concentration of the acid is M and that of base is M. The volume of acid in the flask (Va) = L. 2) Column A In this column you will enter the volume of base added for each step of the titration. This is denoted as Vi in the equations. In filling this column remember that away from the end point the volume increment of the base added can be large (say L), but close to the end point (within L on either side of the end point) smaller increments of the base should be added ( L). Beyond the end point the volume increments of the base can be increased ( L). Fill this column till the maximum volume of the base added is around L. 3) Column B In this column calculate the pH of the solution in the flask for each point.
9 The equation you will use to calculate the pH depends in which region of the titration curve the point lies. (i) Before any base is added the pH is determined by the acid in solution In cell B12 enter the equation = -LOG10(Ca). (ii) Before the end point In cells B13 enter the equation = -LOG10((Ca*Va-Cb*A13)/(Va+A13)). 6. Copy cell B13 and paste into cells B14 down to the cell before the end point (iii) At the end point In column B enter into the cell for the end point (iv) Beyond the end point In the cell after the end point enter the equation = 14 + LOG10((Cb*AX-Ca*Va)/(Va+AX)). where X is the cell number. Copy this cell and paste into cells below. Plot the titration curve You should now have a completed spreadsheet for plotting the titration curve. Select all cells for which there are entries in columns A and B.
10 From the menu select Insert->Chart. Choose an XY scatter plot with a smooth line joining the points. Finish the plot on the same sheet. You should see a titration curve as shown in figure 1. It is also instructive to plot the titration curve but showing the points along the curve. To do this, once again select all points in columns A and B. From the menu select Insert->Chart. Choose an XY scatter plot but this time choose the chart sub-option in the middle left (scatter with data points connected by smooth lines). Finish the plot on the same sheet. This time look at the data points. Notice that close to the end point, points along the y axis (pH) are spaced far apart, even though they are closely spaced in x (volume of base added). This shows that near the end point the pH changes very dramatically with very small increments of added base .