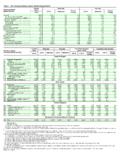
Transcription of Age-standardized death rates per 100,000 by cause
1 Age-standardized death rates per 100,000 by cause Rationale for use The numbers of deaths per 100,000 population are influenced by the age distribution of the population. Two populations with the same age-specific mortality rates for a cause of death will have different overall death rates if the age distributions of their populations are different. Age- standardized mortality rates adjust for differences in population age distribution by applying the observed age-specific mortality rates for each population to a standard population. Definition The Age-standardized mortality rate is a weighted average of the age-specific mortality rates per 100,000 persons, where the weights are the proportions of persons in the corresponding age groups of the WHO standard population.
2 Associated terms None Data sources death registration data for 112 WHO Member States, sample registration systems (India, China), available data on child and adult mortality from censuses and surveys, together with population- based epidemiological studies, disease registers and notifications systems for the estimation of mortality due to 21 specific causes of death . Methods of estimation Life tables specifying all- cause mortality rates by age and sex for 192 WHO Member States were developed for 2002 from available death registration data, sample registration systems (India, China) and data on child and adult mortality from censuses and surveys. cause of death distributions were estimated from death registration data for 107 countries, together with data from population-based epidemiological studies, disease registers and notifications systems for selected specific causes of death .
3 Causes of death for populations without useable death registration data were estimated using cause -of- death models together with data from population-based epidemiological studies, disease registers and notifications systems for 21 specific causes of death . Disaggregation By age and sex. References - Lopez AD, Mathers CD, Ezzati M, Murray CJL, Jamison DT, 2006. Global burden of disease and risk factors. New York: Oxford University Press. ( ). - Mathers, C. D. Uncertainty and data availability for the Global Burden of Disease estimates 2000-2002. Evidence and Information for Policy Working Paper. 2005. Geneva, World Health Organization. ( ). 17 . - Mathers CD, Ma Fat D, Inoue M, Rao C, Lopez AD.
4 Counting the dead and what they died from: an assessment of the global status of cause of death data. Bulletin of the World Health Organization 2005;83(March):171-7. ( No3/bulletin_2005_83(3) ). - Ahmad, O., Boschi-Pinto, C., Lopez, A. D., Murray, C. J. L, Lozano, R., and Inoue, M. Age standardization of rates : a new WHO standard. GPE Discussion Paper No. 31. 2001. Geneva, WHO. Database - WHO Mortality Database: ( ). The data available on this web site comprise deaths registered in national vital registration systems, with underlying cause of death as coded by the relevant national authority. - Estimates of death rates for 2002 by cause for WHO Member States. The Excel spreadsheet contains estimates of numbers, crude rates and Age-standardized rates , as well as information on data sources and levels of evidence.
5 ( ). Comments Uncertainty in estimated all- cause mortality rates range from around 1% for high-income countries to 15-20% for Sub-Saharan Africa, reflecting large differences in the availability and quality of data on mortality, particularly for adult mortality. Uncertainty ranges are generally larger for estimates of death rates from specific diseases. For example, the relative uncertainty for death rates from ischaemic heart disease ranges from around 12% for high-income countries to 25- 35% for Sub-Saharan Africa. The relatively large uncertainty for high-income countries reflects a combination of uncertainty in overall mortality levels, in cause of death assignment, and in the attribution of deaths coded to ill-defined causes.
6 18.
