Transcription of Allocating to Managed Futures: Performance Considerations ...
1 Allocating to Managed Futures: Performance Considerations within a Risk parity FrameworkWilliam Marr and Alexander RudinRAMIUS TRADING STRATEGIES LLCJANUARY 2013 Institutional | Liquid | Alternatives2 IntroductionBoth institutional and retail investors in Managed futures are often challenged with the same two questions: 1. What percentage of my investment portfolio should I allocate to Managed Futures, if any?2. Do Managed Futures still present a differentiated and valid investment opportunity despite 2 back to back years of disappointing Performance ?This paper is an attempt to share our thoughts on the subject. We will describe our asset allocation philosophy and then attempt to use it as a guide to approach the first question. We will also discuss Performance of Managed futures in 2011-2012. We will argue that despite disappointing recent results, the strategy still presents a valid and differentiated investment opportunity for both institutional and retail investment | Liquid | Alternatives3 Risk parity Based ASSET ALLOCATIONIt is generally investors experience that it is much easier to predict an asset s risk than the same asset s return over a given period of time.
2 Financial advisors routinely develop conservative , moderate , and aggressive portfolios for their clients by blending equities, fixed income instruments, and other assets in different proportions. By doing this, the advisors effectively imply that certain assets (for example, equities) have inherently and predictably higher levels of risk than other assets (for example, US Treasury bonds). At the same time, predicting which asset will actually outperform others for a given time period is rightfully understood as one of the biggest challenges of investment management. In other words, our confidence in predicted future returns is lower than our confidence in predicted risks of available investments. How does one translate this confidence gap into the asset allocation scheme? The approach adopted by many institutional investors is known under the umbrella name of Risk parity Based Asset Allocation . The spirit of the risk parity framework is as follows.
3 For an investor with multiple differentiated1 investment opportunities2 at his disposal, he should aim to allocate risk equally to all of them at all times and, through that, maintain a portfolio which is structurally Assets are viewed as differentiated if they are perceived to reflect different sources of investment returns. The differentiation is expected to be manifested through low return correlations over meaningful periods of time and through the complementary behavior during the periods of market We qualify an asset as an investment opportunity if this asset has, in our view, a positive expected return over a full business cycle. Equities, most fixed securities and major hedge fund strategies would generally be considered to meet this condition. An example of type of assets that we would not consider investment opportunities would be various hedging strategies where the economic objective is risk mitigation, as opposed to producing positive expected returns.
4 Predicting which asset will actually outperform others for a given time period is rightfully understood as one of the biggest challenges of investment management. Institutional | Liquid | Alternatives4 Risk parity andTHE TRADITIONAL ASSET MIX The core of most traditional investment portfolios is an allocation to equities and bonds, with risk typically dominated by the former. In fact, a 60/40 portfolio with 60% of assets invested in an equity mix and the remaining 40% invested in some sort of fixed income mix has become a staple investment blend for many investors in the US and beyond, leading to rather volatile returns over the last decade and a half. Let us now illustrate how the risk parity framework can be applied to the asset classes of equities and bonds. For simplicity, throughout this paper we always use the S&P 500 Total Return Index as a proxy for the equity market and the JPMorgan Aggregate Bond Index as a proxy for the bond market (Source: Bloomberg).
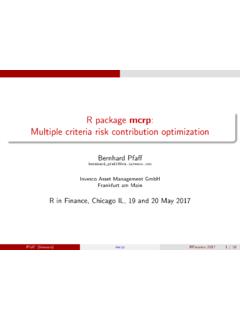
5 By way of example as to how the risk parity framework operates, we built a Risk parity portfolio of equities and bonds by calculating the monthly return volatility3 of each of the two asset classes for every month over the preceding 12 months and then Allocating capital for the following month so that risk contribution of each asset is the same using the formula below:BondsBondsEquitiesEquitiesVolatili tywVolatilityw = The process is then repeated month after month with the portfolio rebalanced the results of this process with the traditional 60/40 blend, we note that even a simple risk parity procedure described above would have yielded a visible improvement in the portfolio risk characteristics without a material loss in return We chose volatility as a proxy for risk and hence a starting point for the risk parity based portfolio construction throughout this paper primarily because of its simplicity. As investors finesse their investment objectives, they may choose other, more refined measures of risk than a simple risk parity have yielded a visible improvement in the portfolio risk characteristics without a material loss in return | Liquid | AlternativesInstitutional | Liquid | Alternatives5 CHART 1: Performance OF EQUITIES, BONDS, AND A 60/40 PORTFOLIO OVER THE LAST 15 YEARSCHART 2: Performance OF EQUITY/BOND RISK parity BLEND VS.
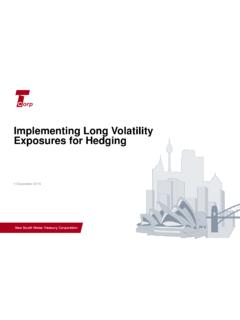
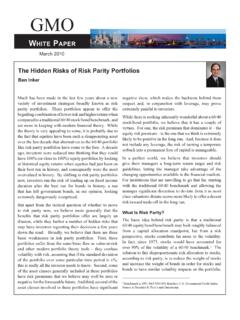
6 A TRADITIONAL EQUITY/BOND 60/40 BLENDCHART 3: Performance OF FIXED WEIGHT PORTFOLIOS ( 60/40 AND 50/30/20 ) AND TWO RISK parity PORTFOLIOS (EQUITY/BOND RISK parity BLEND AND EQUITIES/BONDS/ Managed FUTURES BLEND)9011013015017019021023025027029019 9619971998199920002001200220032004200520 06200720082009201020112012 Performance of $100 BondsEquities60/409011013015017019021023 0250270290199619971998199920002001200220 03200420052006200720082009201020112012 Performance of $10060/40 Bond/Equity Parity9011013015017019021023025027029019 9619971998199920002001200220032004200520 06200720082009201020112012 Performance of $10060/40 Bond/Equity ParityBond /Equity /MF Parity50/30/20 Institutional | Liquid | Alternatives6 Managed Futures WITHIN THE RISK parity FRAMEWORKThe risk parity asset allocation philosophy can easily be expanded to more asset classes than equities and bonds, including Managed futures. A diversified portfolio of Managed futures strategies (which blend is represented throughout this paper by the Barclays Managed Futures Index, Source: BarclaysHedge), in our opinion, satisfies the main criteria for a differentiated investment opportunity 4: Managed Futures have historically demonstrated low to moderate correlation to other traditional investment opportunities over the long term (since 1996, monthly return correlation of Managed Futures to equities is 11% and to bonds is +28%) and during periods of market dislocation (see Chart 4).
7 Managed Futures also have positive expectancy of return over the long term as demonstrated by the 30 years of actual history (Barclays index goes all the way to 1980) and academic research encompassing 100 years of 4: Performance OF Managed FUTURES DURING WORST PERFORMING MONTHS FOR EQUITIES SINCE 19974 CME s write-up entitled Managed Futures: Portfolio Diversification Opportunities may serve as a good introduction to the subject, please see See, for example, a research report by AQR A Century of Evidence on Trend Following Investing , which can be found at -20%-15%-10%-5%0%5%10%Oct-08 Aug-98 Sep-02 Feb-09 Feb-01 Sep-08 Jun-08 Jan-09 Sep-01 May-10 Nov-00 Jul-02 Nov-08 Jun-02 Sep-11 Selected Months' PerformanceUS EquitiesManaged FuturesInstitutional | Liquid | Alternatives7 Institutional | Liquid | AlternativesThe result of applying the risk parity framework to the blend of equities, bonds, and Managed futures is set forth in Chart 3.
8 We built our 3-asset Risk parity portfolio in the same manner as before by evaluating the volatility of each asset over time and rebalancing the portfolio to spread risk evenly across each asset on a monthly basis. The resulting portfolio Performance is plotted on Chart 3. For comparison purposes, Chart 3 also contains Performance of a fixed weight 50/30/20 portfolio comprised of 50% equities, 30% bonds, and 20% Managed simulated 3-asset risk parity portfolio consisting of equities, bonds, and Managed futures easily outperformed other versions on a risk adjusted-basis. In fact, its information ratio6 was (since 1997) as compared to for the 60/40 portfolio, for the 50/30/20 portfolio, and for the 2-asset bond/equities risk parity allocation to Managed futures in this portfolio constituted on average 37%. It is worth noting that the Barclays CTA index, which we use throughout this paper (and hence for the risk parity portfolio construction), has a historical volatility around 7%, which is rather low compared to most investable Managed futures products.
9 When substituted with a more typical, 10-15% annualized volatility product, the average risk parity allocation for Managed futures would end up in the 15-25% range. 6 Information ratio is the commonly used measure of risk adjusted returns of a given asset, which is calculated by dividing annualized returns of that asset by its annualized simulated 3-asset risk parity portfolio consisting of equities, bonds, and Managed futures easily outperforms other versions on a risk adjusted-basis. Institutional | Liquid | Alternatives8 The Emergence ofMANAGED FUTURES MUTUAL FUNDS A very important development of the last few years is the proliferation of liquid alternatives and specifically, the creation of Managed futures mutual funds. Our recent white paper entitled The Emergence of Liquid Alternatives and The Case For Managed Futures Mutual Funds outlines the current liquid alternative investments landscape and illustrates what, in the authors opinion, are the criteria for the successful conversion of a hedge fund strategy into the mutual fund format with consideration to structural issues, liquidity, and daily valuation challenges.
10 The paper illustrates that Managed futures mutual fund products preserve the key investment properties of the strategy described in section 2 herein, with significant improvements in liquidity and transparency when compared to their private placement counterparts. We would like to finish this section with one key point. Adopting a risk parity framework which includes Managed futures has only been possible to implement since the advent of Managed futures mutual funds. Previously, and since the 1970s, this investment strategy was not available through an investment vehicle with the operational ease and daily liquidity required for rebalancing. Overall assets currently in Managed futures mutual fund vehicles are still small when compared to the $300+ billion invested in the strategy globally, but it is an option which is quickly growing. CHART 5: GROWTH OF Managed FUTURES MUTUAL FUNDS(Source: Morningstar)02468102006 2007 2008 2009 2010 2011 2012 AUM (billion USD)Growth of Managed Futures Mutual FundsInstitutional | Liquid | AlternativesInstitutional | Liquid | Alternatives9 The Managed Futures Index IS NEGATIVE FOR A SECOND CONSECUTIVE YEAR.