Transcription of Alpha Bonds Strategy
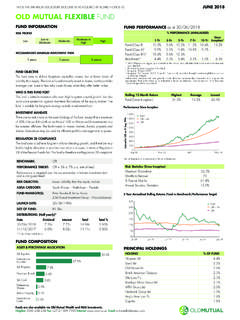
1 $50,000$100,000$150,000$200,000$250,000f or 10 Years Ended September 30, 2018 Alpha Bonds Strategy September 30, 2018 Strategy Philosophy: The Alpha Bonds Strategy is an asset allocation Strategy designed for investors who seek income, low volatility and an ongoing exposure to the bond market without attempting to time swings in interest rates, and without some of the price and credit risks associated with long-term and/or lower grade Bonds . This Strategy combines the performance of conservative bond funds with Alpha s unique seasonal trading protocol to create what we believe is a solution to the conservative investor s dilemma: how to safely invest for income while increasing the asset base at a rate greater than inflation after taxes. Alpha seeks to supplement the returns of conservative bond funds by investing 60% of the portfolio in the Russell 2000 small-cap index leveraged by 50% during three sub-periods (totaling 20 days) in the fourth quarter of each year.
2 Small-cap stocks have historically been positively affected by year-end optimism and these three trades combined have produced positive returns 90% of the time over the past 39 years. We believe that the unique combination of conservative Bonds with the controlled risk exposure to equities in the fourth quarter of each year offers an attractive opportunity for investors who seek capital growth with strong risk management. Strategy Description: Each year, from January 1 until late-October, the Alpha Bonds Strategy holds a position of 70% intermediate-term bond funds and 30% short-term bond funds. Then in late-October, 40% of the portfolio remains in an intermediate-term bond fund while 60% of the portfolio is devoted to three power period trades invested in a Russell 2000 Index fund leveraged by 50%. While not invested in the three fourth quarter trades, 60% of the funds are allocated to cash/money market.
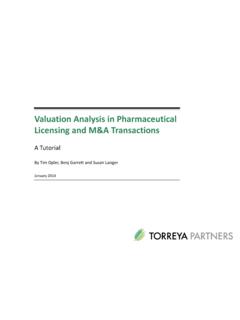
3 HISTORICAL PERFORMANCE FOR PERIODS ENDING SEPTEMBER 30, 2018 Hypothetical Growth of $100,000 for 10 Years Net of Fees Peak to Valley Quarterly Drawdowns for 10 Years Net of Fees Performance Results Net of Fees Risk Overview Last 1 Year Last 3 Years Last 5 Years Last 7 Years For Periods Ending 9/30/2018 Calculated Using Monthly Return Data Alpha Bonds Strategy BB Barclays Interm Treas Alpha Bonds Strategy BB Barclays Interm Treas Alpha Bonds Strategy BB Barclays Interm Treas Alpha Bonds Strategy BB Barclays Interm Treas Standard Deviation Beta relative to Index Alpha relative to Index Sharpe Ratio Correlation relative to Index Maximum Drawdown Disclosure: Past performance is not a guarantee of future performance. Returns presented above include both actual client performance and hypothetical (backtested) performance.
4 Please see following page for complete disclosures. Annual Calendar Year Returns Ended September 30, 201820183 Bonds :Treasury Bloomberg Barclays Intermediate Treasury Index Alpha Bonds Strategy Alpha Bonds Strategy Bloomberg Barclays Intermediate Treasury Index Compound Annual Returns for Periods Ended September 30, 2018 QuarterLast1 YearYearsLast 2 YearsLast 3 YearsLast 4 YearsLast 5 YearsLast 6 YearsLast 7 YearsLast 8 YearsLast 9 YearsLast 10 YearsLast 11 YearsLast 12 YearsLast 13 YearsLast 14 YearsLast 15 Alpha Bonds :Treasury to Alpha Bonds Strategy Data and Illustrations The Alpha Bonds Strategy is an asset allocation Strategy that combines conservative intermediate and short-term bond funds with Alpha s fourth quarter power period trades. The Strategy determines, in advance, when to be invested in bond funds and when to be invested in equities. The investment components of the Strategy are: Jan. 1 to late-October: 70% intermediate-term bond funds / 30% short-term bond funds; late-October to Dec.
5 31: 40% intermediate-term bond fund plus three power period trades using the Russell 2000 Index leveraged by 50%. For more detailed information about this Strategy , please refer to the Alpha Bonds Strategy brochure. Actual client performance: Performance presented since October 2009 represent actual net returns of the Alpha client composite. The net client composite returns include all internal accounts managed by Alpha Investment Management at various custodians that pay Alpha advisory fees ranging from to annually, and as such, individual results may vary. The Alpha client composite returns are calculated using the time-weighted rate of return method. The monthly composite level performance is calculated by asset-weighting portfolio performance, using end of month market values. Trade date accounting is used for calculation and valuation purposes. The composite returns are net of all fees and trading expenses and reflect reinvestment of dividends, interest and capital gains.
6 Performance results do not reflect the impact of taxes. A model portfolio of the same name as this Strategy may be managed by Alpha and offered by investment advisors at various trading/investment platforms, TAMPs, and/or custodians outside the parameters of the internal Alpha client composite returns. Assets invested in such model portfolios may experience significant dispersion in returns from those of the internal Alpha client composite. The causes of dispersion may include, but are not limited to, higher or lower advisory fees, custodial fees, trading expenses, the date on which a client engaged Alpha s investment management services, and the preference/availability of funds used to implement the Strategy ( ETFs vs. mutual funds) at the custodial level. Hypothetical Backtested Performance: Returns presented prior to October 2009 are hypothetical (backtested) and represent a reduction in gross returns of annually for fees and expenses, applied quarterly, which would be expected in a real-time internally managed account.
7 ( Alpha s maximum advisory fee is 2% per annum. The additional reduction of .20% is to approximate the effect of mutual fund expenses during the fourth quarter of each year not already incorporated in the hypothetical returns.) Actual bond funds expenses are incorporated in the backtested data. Returns assume reinvestment of dividends and interest. Performance results do not reflect the impact of taxes. The backtested data does not account for any additional fees and/or trading expenses that may have been incurred at the custodial level. Backtested performance does not represent actual account performance. The backtested data uses index returns for the Russell 2000 to calculate returns for the power period trades in the fourth quarter of each year. The Russell 2000 is an index which cannot be used in actual investing and index funds that replicate the Russell 2000 may vary from the index returns. The backtested data does not include interest and dividends attributed to the Russell 2000 index in the fourth quarter of each year.
8 No allowance for interest/dividends earned on 60% of the portfolio during the fourth quarter is included in the backtested data. Even though the construction of the Strategy is mechanical, objective, and fully disclosed, hypothetical model results have inherent limitations due to the fact that they do not reflect actual trading and may not reflect the impact that material economic and market factors might have had on the advisor s decision-making if actual client funds had been invested in the Strategy . No matter how positive the model returns have been over any time period, the potential for loss is always present due to factors in the future which may not be accounted for in the model. Cautions: The investment Strategy that the backtested results were based upon can (theoretically) be changed at any time with the benefit of hindsight in order to show better backtested results, and (theoretically) the Strategy can continue to be tested and adjusted until the desired results are achieved.
9 Please note that Alpha has not made any data-fitting adjustments to its backtested model. Backtested or hypothetical data must be approached with caution because it is constructed with hindsight and may not reflect material conditions that could affect a manager s decision process, thus altering the application of the discipline. There is no assurance that these backtested results could, or would have been achieved by Alpha during the periods presented. Backtested performance does not represent actual account performance, and the actual results of any Alpha client may have been materially different than the results of the hypothetical results presented. The data used to construct the backtested results and illustrations were obtained from third-party sources, including a database provided by Callan Associates, an institutional investment consultant. While Alpha believes the data to be reliable, no representation is made as to, and no responsibility, warranty or liability is accepted for the accuracy or completeness of such information.
10 The information and opinions expressed in this document are for informational purposes only. Any recommendation or opinion made in this document may not be suitable for all investors. The information contained herein does not constitute and should not be construed as investment advice, an offering of investment advisory services, or an offer to sell or a solicitation to buy any security. Investors should be aware that the use of leveraged funds for 20 days in the fourth quarter of each year increases the volatility and risk of the equity component of the Strategy . Leverage can magnify the losses of an investment during a down market. Given the potential risks involved, strategies employing leverage may not be suitable for all investors. Past performance does not guarantee future performance. No matter how positive the Strategy s returns have been over any time period, there can be no guarantee that the Strategy will perform the same as it has in past time periods.