Transcription of ALPHALINER - files.irwebpage.com
1 Subscription copy for Capital Link. Sent to Unauthorised re-distribution prohibited** The full newsletter is available by subscription. Please contact ** Chart of the week More cash needed as carriers sail into sea of red Average operating margins for the main container shipping lines slipped further into negative territory in the third quarter, dispelling any hopes of a profitable year for the container shipping sector in 2011. With few exceptions, carriers will end the year in the red with the fourth-quarter results expected to be even weaker than those of the third-quarter as volumes and rates are declining fur-ther due to the impact of the winter slack season. The average operating margins of the fifteen carriers surveyed by ALPHALINER fell to -9% in the third quarter compared to -8% in the second quarter of this year. Only one shipping line (Hapag-Lloyd) managed to avoid negative operating fig-ures for the period, while the remaining 14 carriers posted operating losses, with margins ranging from -3% to -25%.
2 The rising losses have created additional pressure to seek fresh cash injections among the carriers as the industry braces for a prolonged downturn that could last for several more quarters. The majority of carriers is currently recording negative EBITDA (earnings before interest, tax, depreciation and amortization), implying cash losses on their operations. The weak results have forced MISC Berhad, which has been the perennial lag-gard among liner operators, to announce its exit from the container market af-ter losing $928 M in the last four years from its liner operations (based on Al- ALPHALINER Weekly Newsletter is distributed every Monday. The newsletter is available upon subscription. Information is given in good faith but without guarantee. Please send your feedback, comments and questions to ALPHALINER Weekly Newsletter to Volume 2011 Issue 48 Web: | E-mail: | Sales: INSIDE THIS ISSUE:INSIDE THIS ISSUE:INSIDE THIS ISSUE:INSIDE THIS ISSUE.)
3 Carriers in a sea of redCarriers in a sea of redCarriers in a sea of redCarriers in a sea of red 1111 Service Updates Service Updates Service Updates Service Updates CKYH to suspend FE-N Europe NE4 string Maersk shuts ICON - first indi-cation that Daily Maersk is not as full as hoped Maersk & GA in TP slot swap H-L to upgrade its Med-NCSA-WCNA 'MPS' service Dole drops Ecuador-Med reefer service - Opts for containers 4444 Corporate UpdatesCorporate UpdatesCorporate UpdatesCorporate Updates MISC to make liner shipping exit CSAV denies sale rumors fol-lowing $342M 3Q net loss Zim to seek cash after posting 3Q $66M net loss 7777 Delivery/New Order UpdatesDelivery/New Order UpdatesDelivery/New Order UpdatesDelivery/New Order Updates November Deliveries 12121212 Pace of capacity idling slows Pace of capacity idling slows Pace of capacity idling slows Pace of capacity idling slows despite service withdrawalsdespite service withdrawalsdespite service withdrawalsdespite service withdrawals 3333 Readers are reminded that unauthorized redistribution of the newsletter is prohib-ited and are requested to quote ALPHALINER as source for all data derived from the newsletter.
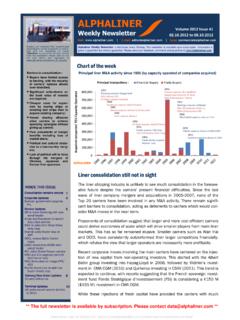
4 Please refer to our full user terms and copyrights at Carriers Operating Profit Margin 3rd Quarter 2011 Carriers operating margins sank further into the red in the 3rd quarter. The weak peak season saw average rates decline compared to the 2nd quarter, while oper-ating costs remained under pressure from high bunker costs. A significant number of carriers has posted negative EBITDA earnings in the 3rd quarter, implying cash losses of their liner opera-tions. The liquidity situation for a number of carriers has be-come more severe, with further deterioration ex-pected in the 4th quarter. The tough operating envi-ronment has forced MISC Berhad to announce its exit from the container market, while several other carriers, including CSAV and Zim, are seeking fresh cash in-jections. Operating margins for container shipping business units only where separately reported (including terminal operations except Maersk & NYK) 2% -3% -4% -4% -5% -6% -6% -6% -8% -9% -10% -10% -13% -24% -25% -25%-20%-15%-10%-5%0%5%Hapag-LloydMaersk MOLWan HaiAPLHMME vergreenZimNYKH anjinK LineYang MingCSCLCSAVMISC ALPHALINER ALPHALINER ALPHALINER ALPHALINER -20% -21% -20% -14% -5% 8% 13% 4% -2% -8% -9% 1Q092Q093Q094Q091Q102Q103Q104Q101Q112Q11 3Q11 Average Operating Margin by Quarter