Transcription of Critical Issues Facing Ports & Marine Terminal …
1 Critical Issues Facing Ports & Marine Terminal Growth the new on of Environmental/Security Compliance2009 MilestonesGlobal Economic Events 2009 begins with world financial system in turmoil Continued global recession Weak consumer demand Falling Real Estate values High unemployment Lackluster retail sales Contraction of world trade Double digit decrease in containerized shipments, resetting to 2004 levels Stock Markets Bottom in March 2009 Oil Prices start 2009 in steep decline, then rebound Excess containership capacity, combined with weak demand, sends freight rates into freefall Unsustainably low ocean freight ratesImpact to Liner industry Record breaking containership capacity (ordered during 2007-2008 peak) being delivered Carriers suspend, consolidate, and eliminate services to reduce capacity Carriers reduce service speeds and add vessels to surviving services to reduce costs and further absorb capacity Idled containership fleet peaks at over 600 vessels, % of total capacity 2009 containership scrapping hits 370k teulevel, exceeding the combined total of previous 10 years Future containership deliveries delayed and/or cancelled throughout 2009 Only 2 small containerships ordered in all of 2009 Vessel charter rates tumble.
2 Carriers renegotiate charter rates Liner industry projected to lose a combined $20 billion in 2009 Several high profile liner operators encounter serious financial difficulties2010 MilestonesGlobal Economic Events 2010 begins with world financial system in recovery Slow recovery from global recession Some recovery in consumer demand Moderating Real Estate values Continued high unemployment Rebound of retail sales Recovery of world trade from disastrous 2009 Recovery in containerized shipments, back to 2007 levels Stock Markets continue upswing from bottom in March 2009 Oil Prices relatively stable Excess containership capacity absorbed by combination of slow steaming and layup, stabilizing freight rates Recovery of ocean freight rates from unsustainably low levelsImpact to Liner industry Carriers selectively add back services to handle increased volumes Carriers continue slow steaming to control costs and capacity Idled containership fleet falls significantly from the 2009 peak Container equipment shortages, brought on by lack of ordering and further aggravated by slow steaming and resumption of service strings.
3 Constrains capacity Future containership orders back from nonexistent 2009 levels Vessel charter rates stabilize Liner industry projected to make a profit in 2010 Several high profile liner operators who encountered serious financial difficulties in 2009 survive and return to profit in 2010 Expected liner industry consolidation does not happen1. Sustained Growth ?As trade recovery proves to be just as uneven as anticipated, the Ports , truckers, and railroads are coping with a volatile mix of growth, thin capacity, and uncertain operating environment. It will not be business as usual when recovery is complete. Alphaliner reported that MTEU has been added to the containership fleet since the start of this year (which represents a 19 percent increase) through a combination of new vessel deliveries and reactivation of idle vessels.
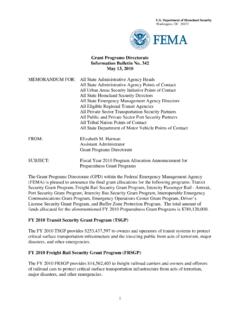
4 The re-activation of the idle fleet has stabilized, and currently stands at percent. Alphaliner expects the idle fleet to stagnate at current levels before rising again by the end of the year. The World Trade Organization stated that the second quarter value of world merchandise trade increased by seven percent, which represents a 35 percent gain over the same period of 2009. China posted a large 41 percent year-on-year increase in exports, while Europe grew by just 13 percent. The figures are based on monthly statistics from about 70 economies that represent about 90 percent of global trade. Source: Global Port Tracker/AlphalinerImports by Coast million TEUs in 2010, a percent increase from 2009 2. Labor Stability/Availability ? Upcoming contracts USEC/USWC Flashpoint Issues ?
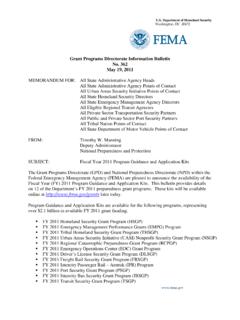
5 ? chassis jurisdiction, credentialing, automation Union leadership USEC and locals Management leadership USMX recent changes Aging work force some areas Unfunded liability in pension funds Increased health and medical costs/benefits Credentialing no workable plan yet, how will implementation be funded artificial limitation of available work force3. Return on AssetsHistorical Evaluation AnalysisPorts index TEV/1-yr forward EBITDA 10x12x14x16x18x20x22x24x1/1/20073/6/2007 5/9/20077/12/20079/14/200711/17/20071/20 /20083/24/2008 TEV/1 yr forward EBITDAP orts indexMedianm edian: Ports index 1-yr forward P/E 20x25x30x35x40x1/1/20073/6/20075/9/20077 /12/20079/14/200711/17/20071/20/20083/24 /20081 yr forward P/EPorts indexMedian m edian: Port valuations for publicly traded companies peaked in the Fall of 2007 and have experienced weakness during recent global market turmoil How will profile of TO S change/evolve at these financial performance levels?
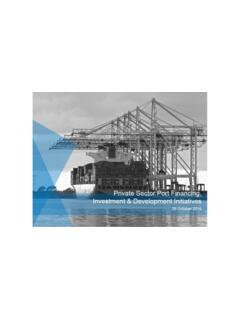
6 New PlayersNorth America Since 2006 HighstarCapitalDateTargetTEU VolumeAcquirerPricePrice/TEUEBITDA MultipleCommentSep-06 HanjinMacquarie Bank$348,000,00040% Stake in LB/Oak/Sea/KHH/OSA/TKONov-06 OOIL Terminals2,568,000 Ontario Teachers' Pension Plan$2,400,000,000$ TSI, NYCT, GlobalDec-06 Halterm210,000 Macquarie Bank$157,430,000$ Dec-06DP World ,593,000 Highstar Capital$1,100,000,000$ Feb-07 Montreal Gateway995,000 Morgan Stanley$409,500,000$ 80% StakeMar-07 Maher Terminals1,900,000 Deutsche Bank$2,100,000,000$1, +Apr-07 AmportsHighstar Capital$430,000,000N/AMay-07 MTC2,458,000 Highstar Capital$860,000,000$ Jul-07 SSA22,000,000 Goldman Sachs$1,600,000,000$ 49% Stake$9,404,930,0004.
7 Security & Safety ChallengesWho pays for all of this??The Coast Guard has projected that portfacilities would need $ billion to pay for securityrequirements over the next 10 years. Since 9/11/01,America s seaports and Terminal Operators have invested hundreds ofmillions of dollars into facility security enhancementswhile the federal government has provided portsapproximately $ billion for security funding. Can Ports /TO s recover these costs from carriers/beneficial cargo owners?Source: AAPA Advisory Safety Occupational Safety and Health Administration (OSHA) Department of Labor (Federal/State Agencies) Workers Comp DOT (Department of Transportation) Federal/State USCG State Agencies Municipalities and Port Authorities Security Department of Homeland Security (DHS) CBP (Customs and Border Patrol) DEA (Drug Enforcement Agencies) Federal/State Transportation Security Administration (TSA) Department of Transportation MARAD USCG State and Local entities (Police, Port Authorities, Licensing Agencies) Environmental Environmental Protection Agency (EPA) Coast Guard (USCG) State Department of Natural Resources (DNR), or Department of Environmental Quality (DEQ).
8 Local Environmental agencies (municipality/port authority requirements) Air Quality MARPOL Annex VI requirements for vessel emission standards and terminals providing reception facilities for ozone depleting substances Emission requirements for cargo handling equipment and company owned vehicles Alternatively powered cargo handling equipment and vehicles Cold Iron electrical shore tie connections Hazardous Material Handling Improperly maintained containers Packaging requirements Hazardous Material Transportation Requirements training for shore side personnel Foresee increased container inspections by regulatory agencies Oil and Hazardous Material Spills Adequate training for staff on response techniques and company set written procedures. Response Procedures being followed Determining Responsible Party (vessel or Terminal ) Waste Water Maintenance facilities limitations on storm drain run off Meeting varying Federal, State, and Local requirements Implementing methods to meet the requirements and needs of Terminals Limitations of Terminals on Port Authority properties Varying requirements that sometimes exceed Federal, state, or local mandated requirements Lack of flexibility, constrained to the use of Port owned equipment Environmental Management System Standardized EMS system tailored for stevedoring business Implementing and maintaining EMS Culture Changing the way we think and do business Biggest Challenge industry focus on upfront costs not long term benefits Education of employees