Transcription of AMERICAN ELECTRIC POWER Transmission Facts
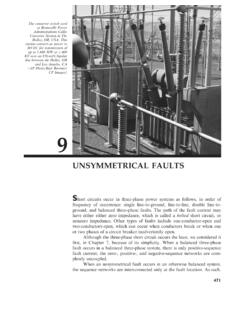
1 AMERICAN ELECTRIC POWER Transmission Facts 1 Q1. What are AEP Transmission mileage statistics? AEP owns the nation s largest electricity Transmission system, a thirty-nine-thousand miles network operating in 11 states that includes more 765 kV extra-high-voltage (EHV) Transmission lines than all other Transmission systems combined. The following statistics summarize AEP s Transmission line circuit miles as of December 31, 2007: Extra-High-Voltage Transmission : 765 kV: 2,116 Miles 500 kV: 113 Miles 345 kV: 5,910 Miles EHV Subtotal: 8,139 Miles High-Voltage Transmission : 230 kV: 140 Miles 161 kV: 282 Miles 138 kV: 16,202 Miles 115 kV: 66 Miles HV Subtotal: 16,690 Miles Below 100 kV: 14,230 Miles AEP Transmission Total: 39,059 Miles Source: AMERICAN ELECTRIC POWER 2008 Fact Book, 43rd EEI Financial Conference, Phoenix, AZ, November 9-12, 2008.
2 Q2. Why did AEP develop 765 kV Transmission ? The decision to develop and implement a 765 kV Transmission overlay in the 1960s (and a 345 kV overlay in the 1950s) was founded in AEP's philosophy that a strong Transmission system is essential to provide efficient, reliable and flexible infrastructure to meet the ever growing demands of electricity consumers. Reliable and efficient, integrated operation requires that the resources of all POWER plants be available, without Transmission constraints, to all parts of the system under a wide range of operating conditions and possible future scenarios. The AEP 765 kV system provides a robust backbone Transmission infrastructure enabling the most economical and environmentally attractive generating resources to supply the growing demand for electricity in a broad variety of operating and market conditions.
3 Source: Development of the AMERICAN ELECTRIC POWER System Transmission Network: From 345 kV to 765 kV to UHV, Nagel and Vassell, CIGRE, No. 32-13, September 1974. Q3. In general, what is the range of cost per mile for each of the following: 765 kV, 500 kV and 345 kV? (Recognizing that terrain, cost of ROW, etc. factor into it) Typical installed costs for 765 kV, 500 kV and 345 kV Transmission lines are: Voltage Class Cost Range/Mile* --------------------- ------------------ 765 kV Single Circuit $ Million 500 kV Single Circuit $ - Million 345 kV Double Circuit $ - Million 345 kV Single Circuit $ Million *Average construction costs in 2008 dollars; rural terrain with rolling hills; elevations up to 4000 feet above sea level; includes siting and ROW costs; excludes station costs.
4 AMERICAN ELECTRIC POWER Transmission Facts 2 The above ranges reflect costs utilizing AEP s current standards and do not include potential design modifications or technology enhancements. These costs can be affected significantly by the following factors: Siting, permitting and/or environmental mitigation requirements Land use, population density and right-of-way land value Terrain and geophysical conditions and their effects on line design and construction Q4. For 765 kV, what is the breakdown of the cost on a percentage basis into labor vs. materials? For the materials percentage, provide a further breakdown for the major components (steel, transformers, etc.) Based on AEP s latest estimates, the following is an approximate cost breakdown for a typical 765 kV Transmission line built with lattice towers: Siting: 3% Right-of-Way (ROW): 10% Engineering & Management: 5% Materials: 41% (of which 60% is structures, 30% conductors, 10% other) Construction: 41% These percentages can vary for different projects and different project decisions.
5 Most significant variations exist in the costs of ROW and materials. For a typical 765 kV Transmission station, the cost breakdown is: Materials: 70% (of which 50% is transformers, 20% circuit breakers, 30% other) Labor: 30% Q7. Are we seeing a shortage of skilled labor and if so, how might that impact our plans? Presently, AEP is not experiencing a shortage of skilled labor. In the future, if a significant number of projects were scheduled to go into construction simultaneously, a shortage of skilled labor could arise. Were that to happen, we would work with our contractors to develop and train a larger workforce. Since there would be some advance visibility to this issue, we would have time to respond to the need. Q8. How does the size of the ROW compare/differ between 765 kV, 500 kV and 345 kV?
6 The ROW width commonly used for 765 kV, 500 kV and 345 kV lines is summarized below: Voltage Class ROW Width - Feet --------------------- ---------------- 765 kV Single Circuit 200 500 kV Single Circuit 175 - 200 345 kV Double Circuit 150 345 kV Single Circuit 150 Q9. What is the average height of 765 kV, 500 kV and 345 kV towers? Tower heights vary with design and terrain type, and generally increase with voltage class. Note that a double-circuit 345 kV tower is actually taller than a single-circuit 765 kV design. AMERICAN ELECTRIC POWER Transmission Facts 3 Tower Height - Feet Voltage Class Hilly Terrain Flat Terrain --------------------- ------------- ------------ 765 kV Single Circuit 135 150 500 kV Single Circuit 120 135 345 kV Double Circuit 160 175 345 kV Single Circuit 110 125 Q10.
7 Are there altitude restrictions for Transmission ? If so, how can they be mitigated? High elevations above sea level are associated with reduced air density, which affects the performance of Transmission lines. Specifically, as the air density declines so does its dielectric strength, resulting in greater discharge of energy from energized surfaces. This effect, known as corona, can manifest itself as audible noise and may have to be controlled to meet local regulations. Effective mitigation methods at EHV levels are to use multiple conductors in each phase and/or optimized phase bundle geometries. Reduced air density also can lower the flashover voltage threshold, necessitating more insulation or effective means for overvoltage control. Q11. What are the load carrying capabilities of 765 kV, 500 kV and 345 kV in terms of MW and miles?
8 To assess the load-carrying ability, or loadability, of a Transmission line , engineers commonly use the concept of Surge Impedance loading (SIL). SIL, a loading level at which the line attains self-sufficiency in reactive POWER ( , no net reactive POWER into or out of the line ), is a convenient yardstick for measuring relative loadabilities of long lines operating at different nominal voltages. Using the SIL concept, three 500 kV or six 345 kV circuits would be required to achieve the loadability of a single 765 kV line . Specifically, a 765 kV line can reliably transmit 2200-2400 MW ( , SIL) for distances up to 300 miles, whereas the similarly situated 500 kV and 345 kV lines with bundled conductors can deliver only about 900 MW and 400 MW, respectively. For short distances, these relationships can differ to some extent reflecting thermal capacities established primarily by the number/size of line conductors and station equipment ratings.
9 Relative loadabilities of the 765 kV, 500 kV and 345 kV lines also can be viewed in terms of Transmission reach over which a certain amount of POWER , say 1500 MW, can be delivered. For a 765 kV line , this loading represents approximately SIL which, according to the loadability characteristic (see below), can be transported reliably over a distance of up to 550 miles. By contrast, a 345 kV line carrying the same amount of POWER would operate at SIL -- transportable only up to about 50 miles (assuming adequate thermal capacity); this distance would increase to about 110 miles for a double-circuit 345 kV line . The generalized line loadability characteristic incorporates the assumptions of a well-developed system at each terminal of the line and operating criteria designed to promote system reliability.
10 Voltage Class Loadability (@300 Miles) Reach (@1500 MW) --------------------- ------------------------ ------------------ 765 kV Single Circuit 2200 2400 MW 550 Miles 500 kV Single Circuit 900 MW 140 Miles 345 kV Double Circuit 800 MW 110 Miles 345 kV Single Circuit 400 MW 50 Miles AMERICAN ELECTRIC POWER Transmission Facts 4 Source: Analytical Development of Loadability Characteristics for EHV and UHV Transmission Lines, Dunlop, R. Gutman and Marchenko, IEEE Transactions on POWER Apparatus and Systems, Vol. PAS-98, No. 2, March/April 1979. Q12. What are the standard statistics for line losses? How do line losses compare/differ between 765 kV, 500 kV and 345 kV?