Transcription of An Analysis of Demand Elasticities for Fluid Milk Products ...
1 An Analysis of Demand Elasticities for Fluid milk Products in the Christopher Davis1, Donald Blayney2, Joseph Cooper3 and Steven Yen4 1 Economist with the Markets and Trade Economics Division, Economic Research Service, Department of Agriculture. 1800 M Street, NW, Washington 20036. Phone: (202) 694-5167. Email Address: 2 Senior Economist with the Markets and Trade Economics Division, Economic Research Service, Department of Agriculture. 1800 M Street, NW, Washington 20036. Phone: (202) 694-5171. Email Address: 3 Senior Economist with the Markets and Trade Economics Division, Economic Research Service, Department of Agriculture. 1800 M Street, NW, Washington 20036. Phone: (202) 694-54821. Email Address: 4 Associate Professor in the Department of Agricultural Economics, the University of Tennessee, Knoxville, Tennessee.
2 Phone: (865) 974-7474. Email address: Contributed Paper prepared for presentation at the International Association of Agricultural Economists Meeting, Beijing, China, August 16 - 22, 2009. _____ Disclaimer: The opinions and Analysis presented represent the authors ideas and do not necessarily reflect those of Economic Research Service or the Department of Agriculture position. 2 An Analysis of Demand Elasticities for Fluid milk Products in the Abstract: This study examines retail Fluid milk Products purchase data from Nielsen 2005 home scan data. The Demand for seven categories of Fluid milk Products were estimated: whole milk , whole flavored milk , reduced fat milk , flavored reduced fat milk , buttermilk, canned milk and all other Fluid milk Products . Analyses of the purchases of seven Fluid milk categories based on the Nielsen 2005 home scan retail data are used to determine the roles marital status, age, race, education, female employment status and location play in the empirical estimations of aggregate Demand Elasticities .
3 To derive the Demand Elasticities , a censored translog Demand system is used. The results reveal that price and income are the main determinants of Demand for Fluid milk Products with a few minor determinants. All own-price Elasticities are greater than unity for all Fluid milk categories except for the compensated reduced fat milk . All expenditure Elasticities are inelastic except for reduced fat milk and most of the Fluid milk categories are substitutes. Keywords: Nielsen home scan retail data, milk Demand , Elasticities , Fluid milk , reduced fat milk , whole milk , flavored milk , canned milk , buttermilk, non-linear AIDS, censored translog Demand system JEL Classifications: C25, D12, Q11 3 Introduction Of all milk and dairy Products , Fluid milk Products are probably the most often discussed and analyzed, although cheese is a close second.
4 The interest in the Fluid Products stems from several factors. There is a long historical record expounding the merits of milk and its Products , not always from dairy cows, throughout the world. The significant role played by the Fluid Products in promoting health, especially of young children, is emphasized. So too is the importance of dairy Products as sources of vitamins and minerals that support bone health. Taken together, one can appreciate how it is possible for many people to hold deep convictions about milk and its Products . milk and dairy Products are often described as manufactured or processed Products . It is the processed Products , but not all of them, that are the Fluid Products considered in this study. Fluid milk Products Our interest (and Analysis ) is focused on the Fluid beverage milk Products , not cream-based processed Products such as half-and-half, sour creams, or yogurt.
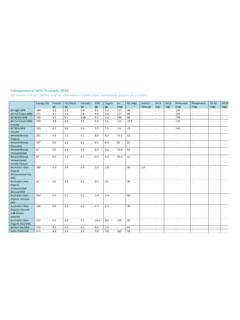
5 Figure 1 shows estimates of total beverage milk sales and selected individual milk category sales over the past several years. The data are defined in terms of pounds, a weight measure that can at times confuse those wishing to think in terms of volume, a more traditional way to think of liquids. Converting the weight to a liquid volume base, at least in an approximate fashion, is simple divide the weight in pounds by (see Appendix table 1). 4 Total sales have been relatively stable over the 1975- 2007 period at approximately 54 billion pounds. However, the sales trends of selected individual categories offer a different perspective that is shown clearly in Figure 1. Figure 1 Total and selected category beverage milk sales, 1975 to 2007010,00020,00030,00040,00050,00060,00 0197519761977197819791980198119821983198 4198519861987198819891990199119921993199 419951996199719981999 200020012002 2003 2004 200520062007 Million poundsWhole2%1%SkimTotal Whole milk sales have been declining over the period while the reduced fat milk category sales (2%, 1%, and skim) have trended upward, with clear peaks for 2% and skim followed by declines.
6 However, there have been upward sales again in both categories in the most recent years. The relatively short shelf-life of the Fluid beverage milk Products has certain ramifications for Analysis of Demand . Lacking estimates of consumer wastage on a consistent basis, it is assumed that sales of the Products are equal to the demands for them. 5In most product Demand studies, the focus is per capita Demand . Based on the sales shown in figure 1, per capita Demand estimate, utilizing the July1 annual estimates of the total population are calculated. The three reduced fat (2%, 1%, and skim) milk categories have also been added together. The per capita Demand trends are shown in Figure 2 for total milk and selected Fluid beverage milk categories. Figure 2 Per capita Fluid beverage milk Demand , 1975-20070501001502002503001975197619771 9781979198019811982198319841985198619871 9881989199019911992199319941995199619971 9981999 200020012002 2003 2004 200520062007poundsWhole milkReduced fat milkTotal milk The downward per capita total Demand is directly related to the relatively flat total sales and the increasing population of the United States over time.
7 As is clearly seen, the aggregate trend masks an important point per capita Demand of the reduced fat milk (s) had been trending upward for some time but leveled off and actually declined in the early 2000s. More recent data shows an upward movement for these milk categories. However, the whole milk Demand trend is continually downward over the period. Mirroring the sales data (when aggregated over the 6three reduced fat categories), per capita Demand for the reduced fat milks surpassed the whole milk Demand in 1988. In 2005, total beverage milk sales, on a per capita basis were about gallons. The non-flavored reduced-fat milk Products represented about 59 percent of the total with 2-percent the highest at gallons, followed by skim milk ( gallons) and 1-percent ( gallons). Non-flavored whole milk , at gallons, made up about 31 percent of the total.
8 Whole milk per capita Demand fell from almost 20 gallons in 1975, a decline of almost 2/3 thirds, while the reduced fat Demand has risen almost 50 percent for 2-percent, 73 percent for 1-percent, and over 138 percent for skim milk . The variation in the Demand trends suggests that any Demand analyses of the Products ought to examine the potential factors behind the trends. Of major interest are Elasticities of Demand for the various Fluid milk Products and the frameworks used to derive Demand estimates. Other demographic factors may also be important contributing factors to the variation in demands. Previous Analysis of Fluid milk Markets Analyses of Fluid milk Demand have taken many forms over the years and have emphasized many different factors found to influence demands. Early studies tended to consider milk as an aggregate category but as the various Fluid milk types were produced and sold, more data became available to disaggregate the Products .
9 While there are differences in packaging that can be studied, the differences between demands for milks with different fat content took, and still 7holds, center stage. There is no effort to catalog all of the studies completed and report results rather we referenced the key studies across a historical time period. An early study by Boehm and Babb (1975) identified six milk categories regular whole milk , total whole milk , 2-percent, 1-percent, skim nonfat milk , buttermilk and a total, for Analysis . Price Elasticities were reported in two ways: by household and per capita. The household estimates were interpreted as long run response measures while per capita Elasticities are short run. The smallest (in magnitude) of the long run responses was for 1-percent milk at and the largest was for regular whole milk at Per capita estimates were smaller in magnitude, ranging from for skim nonfat milk to for buttermilk.
10 Gould, Cox, and Perali (1990) specified an Almost Ideal Demand System (AIDS) model that included whole milk and lowfat milk . Demand Elasticities were estimated to be for whole milk and for lowfat and expenditure Elasticities were and In 1996, Gould again examined milk Demand factors but this time there were three categories considered whole milk , 2-percent milk , and 1-percent/skim milk . Nielsen data from April 1991 to March 1992 was used for the Analysis . Own-price Elasticities were estimated to be for whole milk , for 2-percent, and for the 1-percent/skim category. All expenditure Elasticities were close to 1. In a study by Schmit et al., (2002), price and expenditure Elasticities for three individual milk categories, whole, lowfat, and skim, along with a total milk category were determined in a study focusing on generic advertising effects.