Transcription of AN APPLICATION OF SIMULATION AND VALUE …
1 AN APPLICATION OF SIMULATION AND VALUE STREAM MAPPING INLEAN MANUFACTURINGYang-Hua Lian, Hendrik Van LandeghemDepartment of Industrial ManagementGhent UniversityTechnologiepark, 903, B-9052, Ghent, Belgiumemail: manufacturing , SIMULATION , VALUE Stream MappingABSTRACTP hysical factory layout redesigns or changes of the supplychain infrastructure involve high costs. Through simulationand VALUE stream mapping, managers can see the impactsbefore the implementation and transform the organizationinto a lean one at minimal cost. In this paper, we investigatesome relevant lean manufacturing literature where leanprinciples and tools are presented or utilized. Twosimulation models are built for two respective scenarios,push and pull (kanban) systems. Model templates areexplained and the key measurements such as lead times,throughput rates, VALUE -added ratios are compared as wellas evaluated.
2 The effects of lean are clearly demonstratedby the INTRODUCTION"Lean" has been originally created and defined as theelimination of muda (waste) in the book "The Machine thatChanged the World" by Womack, Jones, and Roos(Womack et al. 1990). Several cases are illustrated in thesequel "Lean Thinking" (Womack and Jones 1996). In thisbook, crises in various business units with different culturesand mentalities (America, Germany, Japan), within severalindustries ( manufacturing tools, cars, airplanes, .., etc.),from a little company with 400 people to a big enterprisewith 29,000 employees, are tackled by carrying out the keyprinciples of lean philosophy (Womack and Jones 1996;Rother and Shook 1999):(1) Define VALUE from the perspective of the customer,(2) Identify the VALUE streams,(3) Flow,(4) Pull,(5) Strive to the lean philosophy, " VALUE " is determined by the endcustomer.
3 It means identifying what the customer is willingto pay for, what creates " VALUE " for him. The whole processof producing and delivering a product should be examinedand optimized from the customer s point of view. So once" VALUE " is defined, we can explore the VALUE stream, beingall activities both VALUE -added and non- VALUE added thatare currently required to bring the product from rawmaterial to end product to the customer. (Rother and Shook1999). Next, wasteful steps have to be eliminated and flowcan be introduced in the remaining VALUE -added concept of flow is to make parts ideally one piece at atime from raw materials to finished goods and to movethem one by one to the next workstation with no waitingtime in between. Pull is the notion of producing at the rateof the demand of the customer. Perfection is achieved whenpeople within the organization realize that the continuousimprovement process of eliminating waste and reducingmistakes while offering what the customer actually wantsbecomes possible (Womack and Jones 1996; McDonald etal.)
4 2000).II. IMPLEMENTING LEAN CONCEPTST ools (methodologies) that are part of "Lean" are addressedin literature. In (McDonald et al. 2000; Rahn 2001), the pulltechnique of only producing what is required when it isrequired is used in the improved phases. The results are lessrework and scrap, lower work-in-process, reduced leadtime, increased throughput rate and higher service tools such as standard work (Cudney and Fargher2001), quick changeover (Van Goubergen and VanLandeghem 2001; 2002), 5S (Henderson and Larco 2000),etc. can be referred to the works in the contrast to the well-defined and rich set of lean tools andmethods (Henderson and Larco 2000), as promoted by theLean Enterprise Institute, there exist very fewimplementation methods. In recent years, VALUE streammapping (VSM) has emerged as the preferred way toimplement lean.
5 VALUE stream mapping is a mapping toolthat is used to describe supply chain networks. It maps notonly material flows but also information flows that signaland control the material flows. The material flow path ofthe product is traced back from the final operation in itsrouting to the storage location for raw material. This visualrepresentation facilitates the process of lean implementationby helping to identify the VALUE -added steps in a valuestream, and eliminating the non- VALUE added steps/waste(muda) (Rother and Shook 1999).Despite its success, VSM has some drawbacks:(1) VSM is a paper and pencil based technique usedprimarily to document VALUE streams. It is composed byphysically walking along the flow and recording whathappens on the floor. This will limit both the level ofdetail and the number of different versions that we canhandle.
6 (2) In real world situations, many companies are of a highvariety, low volume type, meaning that many valuestreams are composed of many tens or hundreds ofindustrial parts and products. This adds a level ofcomplication (and variability) that cannot be addressedby normal methods.(3) Revealing as a VSM map can be (see Figure 1 and 2 asexamples), many people fail to see how it translatesinto reality. So, the VALUE stream map risks ending up asa nice poster, without much further SIMULATION AS PART OF VSMTo address these shortcomings while preserving theintuitive set of symbols of VSM, we propose to usesimulation as a documentation and implementation ways of SIMULATION are shown in the papers:(1) Physical SimulationsWhitman et al. present a physical SIMULATION game whereparticipants operate workstations along the assembly line ina mythical aircraft plant.
7 Through a series of four scenarios(different supply chain maps), participants encountersupplier, service level, quality control problems and so a result of participating this game, people implementand learn about lean concepts such as cellularmanufacturing, pull system, one-piece-flow, etc (Whitmanet al. 2001). We introduce here a physical game, buildingStyrofoam trains. It has been adopted for VSM use basedon the JET game described in (Van Landeghem and Dams1995).(2) Computer-Aided SimulationsIn (Van Landeghem and Debuf 1997; Van Landeghem1998; McDonald et al. 2000; Rahn 2001), simulationmodels are built by using computer software and applied tothe real world cases. Simulations are used to modelmanufacturing processes for a core product family andvalidate the current state map as well as evaluatingalternative scenarios of future state see two main reasons for using of SIMULATION models:(1) SIMULATION as a Cost Saving ToolThe use of a SIMULATION model can help managers see theeffects before a big implementation: the impact of layoutchanges, resource reallocation, etc.
8 On the key performanceindicators before and after lean transformation without hugeinvestment (Van Landeghem and Debuf 1997, Rahn 2001).(2) SIMULATION as a Training ToolIn most companies, especially when they are small, newconcepts are hard to introduce. SIMULATION has proven to bea powerful eye-opener (Van Landeghem and Debuf 1997;Van Landeghem 1998; Whitman et al. 2001). Bycombining SIMULATION with the visual map of VSM, we aimto achieve faster adoption and less resistance to changefrom the THE EXAMPLEA mythical train manufacturer produces multiple products(general trains, fast speed trains, freight trains, etc.). Wechoose a core product family, general trains that exist in 3different sizes large, medium, and small. After drawing itsvalue stream maps (current state and future state), we buildthe SIMULATION models representing these two maps.
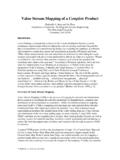
9 Thisexample exists as a physical SIMULATION game (VanLandeghem and Dams 1995). By using the same example,we will compare in future experiments with are two scenarios being simulated. The two supplychain networks that we simulate are shown in Figure 1 and2. The first scenario or the "current state" is a MRP(Material Requirements Planning) based production is a production control-planning centre, whichgenerates the time schedule specifying the time (when) andthe amount (how much) of materials, parts, and componentsthat should be ordered or produced. The manufacturingprocesses (the rectangles in Figure 1) consist of materialpurchasing from suppliers, cutting strips, cutting A/B typestrips, cabin assembly, chassis assembly, final assemblyand shipping to customers. A typical characteristic of thiskind of production system is the inventory storage points inbetween (the triangles in Figure 1).
10 The second scenario or the "future state" is a kanban basedsystem (Figure 2), also called "lean production" system,which is based on the logic that nothing will be produceduntil it is needed. When a train is ordered by a customer,firstly, the last workstation takes the parts needed from theupstream supermarkets. The supermarket is a tool of thepull system that helps signal demand for the product. In asupermarket, a fixed amount of raw material, work inprocess, or finished product is kept as a buffer to schedulevariability or an incapable process. A supermarket istypically located at the end of a production line (or theentrance of a U-shaped flow line) (Rother and Shook 1999).C/T=40secC/O=20secUptime=100%EPE=m inScrap= 0%Production Control(Staging)ShippingSupplier45 per hour50% M 33% S 17% Lper unitDLT= 3minCustomerweekForecastHourlyOrderDaily fax2 x day1x HourOrderOXOX1111 PanelPanelPanelC/OReworkreductionCutting strips22 S2 M2 L1 Cutting 2 B1 Takt =30secC/O=26sec1 S1 M1 LCut+Ass CabinTakt=40secC/O=28secTotal work=75sec1 S1 M1 L11 Ass+Chassis+Insp11 Takt= 80secC/O=0 Total work=150secFIFOC/TStrips40sec12 min4min75sec150secPLT =16 min + 4,4min=20,4 minVAT =265 4,4 minRatio= 21,5%C/T=40secC/O=20secUptime=100%EPE=mi nScrap= 0%C/T=40secC/O=20secUptime=100%EPE=minSc rap= 0%Production Control(Staging)Shipping(Staging)