Transcription of An Introduction to Sensitivity Analysis - MIT …
1 D-4526-2 41 An Introduction to Sensitivity Analysis Prepared for the MIT System Dynamics in Education Project Under the Supervision of Dr. Jay W. Forrester by Lucia Breierova Mark Choudhari September 6, 1996 Vensim Examples added October 2001 Copyright 2001 by the Massachusetts Institute of Technology Permission granted to distribute for non-commercial educational purposes 47 D-4526-2 43 Table of Contents 1. ABSTRACT 46 2. Introduction 3. EXPLORATORY EXERCISES EXPLORATION 1: LEMONADE STAND 48 EXERCISE 51 DEBRIEF 55 EXPLORATION 2: EPIDEMICS 55 EXERCISE 57 DEBRIEF 62 4.
2 INDEPENDENT EXPLORATION: COFFEEHOUSE 62 CHOOSING PARAMETERS FOR Sensitivity Analysis 65 PERFORMING Sensitivity TESTS 65 5. CONCLUSION 66 6. SUGGESTED SOLUTIONS TO SECTION 4 SOLUTION TO SECTION 67 SOLUTION TO SECTION 67 DEBRIEF 74 7. APPENDIX: MODEL DOCUMENTATION 75 LEMONADE STAND MODEL 75 EPIDEMICS MODEL 76 COFFEEHOUSE MODEL 77 48 67 44 D-4526-2 7. VENSIM EXAMPLES 81 46 D-4526-2 Abstract This paper is an Introduction to a series of papers on Sensitivity Analysis . It contains three exploratory exercises demonstrating the effects of various parameter and initial value changes on system behavior.
3 The paper assumes that the reader is able to build and understand a multiple-level model, and has experience with the Sensitivity feature in the STELLA We encourage the reader to build all the models and to run the simulations described. 1 For a review of the Sensitivity feature in STELLA, please refer to your STELLA user manual or to Road Maps 3: A Guide to Learning System Dynamics (D-4503-3), System Dynamics in Education Project, System Dynamics Group, Sloan School of Management, Massachusetts Institute of Technology, p. 12-13. STELLA is a registered trademark of High Performance Systems, Inc.
4 D-4526-2 47 Introduction Sensitivity Analysis is used to determine how sensitive a model is to changes in the value of the parameters of the model and to changes in the structure of the model. In this paper, we focus on parameter Sensitivity . Parameter Sensitivity is usually performed as a series of tests in which the modeler sets different parameter values to see how a change in the parameter causes a change in the dynamic behavior of the stocks. By showing how the model behavior responds to changes in parameter values, Sensitivity Analysis is a useful tool in model building as well as in model evaluation.
5 Sensitivity Analysis helps to build confidence in the model by studying the uncertainties that are often associated with parameters in models. Many parameters in system dynamics models represent quantities that are very difficult, or even impossible to measure to a great deal of accuracy in the real world. Also, some parameter values change in the real world. Therefore, when building a system dynamics model, the modeler is usually at least somewhat uncertain about the parameter values he chooses and must use estimates. Sensitivity Analysis allows him to determine what level of accuracy is necessary for a parameter to make the model sufficiently useful and valid.
6 If the tests reveal that the model is insensitive, then it may be possible to use an estimate rather than a value with greater precision. Sensitivity Analysis can also indicate which parameter values are reasonable to use in the model. If the model behaves as expected from real world observations, it gives some indication that the parameter values reflect, at least in part, the real world. Sensitivity tests help the modeler to understand dynamics of a system. Experimenting with a wide range of values can offer insights into behavior of a system in extreme situations. Discovering that the system behavior greatly changes for a change in a parameter value can identify a leverage point in the model a parameter whose specific value can significantly influence the behavior mode of the 2 In this paper, the term behavior mode refers to the general kind of behavior, such as exponential growth, asymptotic growth, S-shaped growth, or oscillation.
7 48 D-4526-2 Exploratory Exercises In this section we look at two models and explore how sensitive they are to changes in parameters and initial values of stocks. The first exploration shows that parameter changes produce some change in the appearance of behavior of the system, but they do not change the behavior mode. The second exploration demonstrates that changes in different parameters create different types of changes in the behavior of the system. In the first exploration, we conduct Sensitivity Analysis on all the constant parameters in the model. However, in a large model, such an extensive treatment of Sensitivity Analysis is often The modeler must pick the parameters he expects to have most influence on the behavior, or the ones that he is most uncertain about, and only use those in the Sensitivity Analysis .
8 We will see in the second exploration that an examination of the structure of the model can indicate, without running the Sensitivity tests, what kind of effect changes in some parameters would have. An explanation of how to choose the parameters for testing will be offered in later papers in the Sensitivity Analysis series. Exploration 1: Lemonade Stand In the first exploration, let s look at a lemonade stand located on a college campus. As usual, we are particularly interested in the behavior of the stock, the number of cups of lemonade that are ready to be sold to customers.
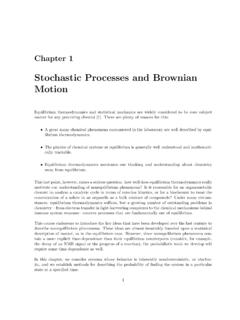
9 The stand is open eight hours every day. Howard, the owner, is the only person working in the stand. We encourage you to try to build the model and then compare it with the model suggested in Figure 1. The model documentation and equations can be found in section of the 3 Some system dynamics software, such as Vensim, can make automatic Sensitivity tests of all parameters. Vensim is a registered trademark of Ventana Systems, Inc. 4 The Lemonade stand model is based on: John Sterman, 1988. Formulation of a simple business model (D-4148), , System Dynamics for Business Policy, System Dynamics Group, Sloan School of Management, Massachusetts Institute of Technology.
10 D-4526-2 49 Lemonade ready in stand Selling Making lemonade Buying lemonade Expected lemonade buying Change in buying expectations Time to average lemonade buying Lemonade coverage Desired amount of lemonade Correction in amount of lemonade Time to correct amount of lemonade Figure 1: Model of the Lemonade stand The stock, called Lemonade ready in stand, is increased by an inflow called Making lemonade, and decreased by the outflow, Selling. Selling (cups per hour) is equal to Buying lemonade, an exogenous parameter (not present in a feedback loop of the system).