Transcription of Introduction to EDS analysis - EMC
1 Introduction to EDS analysis Reference Manual Bruker Nano GmbH Schwarzschildstr. 12 12489 Berlin Tel. +49 (30) 670 990-0 Fax +49 (30) 670 990-30 E-mail Internet The reproduction, transmission or use of this document or its contents is not permitted without express written authority. Offenders will be liable for damages. All rights reserved. We have checked the contents of this manual for agreement with the hardware and software described. Since deviations cannot be precluded entirely, we cannot guarantee full agreement. However, the data in this manual are reviewed regularly and any necessary corrections are included in subsequent editions.
2 Suggestions for improvement are welcome. Order no. DOC-M82-EXX053. 2011 Bruker Nano GmbH, Berlin, Germany. All trademarks and registered trademarks are the sole property of their respective owners. Printed in the Federal Republic of Germany. Contents QUANTAX 3 Contents 1 Introduction .. 5 2 Microanalysis Basics .. 7 Overview .. 9 Quantitative analysis .. 10 True Standardless analysis with P/B-ZAF .. 10 Standard-based analysis .. 11 Reference-based analysis .. 12 Standard-based P/B-ZAF- analysis .. 12 Combined analysis Methods .. 13 Imaging Functions .. 13 Standard Image Capture .. 13 ColorScan .. 14 Mapping and Element Imaging.
3 14 Hyperspectral Mapping .. 15 Object analysis , Multipoint, and Line scan .. 15 Object analysis .. 15 Multipoint analysis .. 15 Line Scan .. 16 analysis Limits .. 16 The analysis Volume .. 16 Spatial Resolution .. 17 Analyzing Inhomogeneous Samples .. 17 Sensitivity of X-ray Microanalysis .. 18 Limit of Detection .. 18 Accuracy and Precision .. 18 Special Consideration for TEM analysis .. 19 3 Performing X-ray Microanalysis .. 23 Preparing Microanalysis Samples .. 25 Embedding and Contacting .. 25 Grinding and Polishing .. 25 Coating Samples .. 25 Sample Mounting .. 26 Setting up the Microscope.
4 26 Microanalyzer Settings .. 28 Image System Settings .. 28 Detector Position .. 28 X- ray Spectrometer Functions .. 29 Parameter Data Transfer .. 29 System Calibration .. 30 Avoiding analysis Errors .. 31 Checking Sample State .. 31 Maintaining System Calibration .. 31 Understanding Spurious Peaks .. 32 Avoiding Carbon Contamination .. 32 Detecting Inadequate Settings .. 33 Using the Right analysis Method .. 34 Appendix .. 37 User Manual Contents 4 History of Energy Dispersive X-ray Microanalysis .. 39 The Sources of X-rays .. 40 Absorption and Fluorescence .. 42 Semiconductor Detector Effects .. 44 Conventional Quantitative analysis Procedures.
5 46 P/B-ZAF Spectrum analysis Background .. 46 Further Reading .. 50 Index .. 51 1 Introduction This manual offers an Introduction to the basic principles of energy dispersive spectrometry (EDS). The main goal is to provide some general information on the analysis possibilities when using an EDS system and to summarize some background knowledge that will help to optimize analysis results. The first chapter deals with different strategies for quantitative analysis , from true standardless to standard-based quantification, as well as combined analysis methods. This is followed by a description of the typical imaging functions of an X- ray microanalysis system, together with information on the acquisition of element distribution images, hyperspectral maps and line scans.
6 A discussion on the EDS analysis limits rounds off this section. The second chapter is dedicated to the explanation of different factors that have to be taken into consideration when performing practical X- ray microanalysis. These factors inlcude sample preparation, setup of the electron microscope, spectrometer settings and system calibration. A list of frequent analysis errors and the way to avoid them closes this part of the manual. Finally, the appendix contains some general EDS information including topics such as the history of energy dispersive X-ray microanalysis, absoprtion and fluorescence, detector effects, etc.
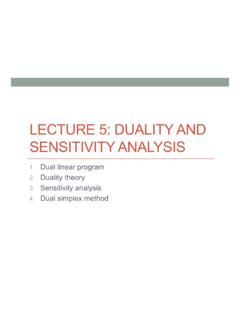
7 In form of an extended glossary. 2 Microanalysis Basics Overview .. 9 Quantitative analysis .. 10 Imaging Functions .. 13 Object analysis , Multipoint, and Line scan .. 15 analysis Limits .. 16 User Manual 2 Microanalysis Basics 8 Overview QUANTAX 9 Overview Fig. Typical analysis geometry General spectrum analysis steps Spectrum acquisition Correction of the detector effects (Escape, Shelf, Tail, Shift) Identification of the elements and selection of a line series for each element Calculation of the bremsstrahlung background radiation ( bremsstrahlung) Deconvolution of overlapping peaks and estimation of the net intensities Calculation of concentrations with or without reference to standards Result formatting and presentation X-ray generation.
8 Scanning electron microscopes (SEM) or similar devices scan the specimen with a beam of high-energy electrons. By interaction of these electrons with the atoms of the specimen, secondary electrons, backscattered electrons, characteristic X-ray photons, and bremsstrahlung are generated. While the different electron detectors of the microscope (SE, BSE) deliver images of the specimen - revealing surface structure and topology - the X-ray spectrometer adds detailed information about the chemical composition for a given measure-ment spot or area. Qualitative analysis . The characteristic X-rays consist of narrow emission lines, which are characteristic for the chemical elements contained in the sample.
9 The energy of these lines is nearly independent of the chemical bonding state of the affected atoms; the electron probe microanalysis (EPMA) is element sensitive. In the resulting energy dispersive spectrum the characteristic X-rays correspond to visible peaks. Identifying these peaks yields information about the elements that are present in the sample. Quantitative analysis . Quantitative data about the sample composition is derived from the different peak intensities by an extensive mathematical process, often referred to as ZAF or PhiRhoZ matrix correction.
10 Bremsstrahlung X-rays, which form a continuous spectrum background, are used as additional source of information during the spectrum analysis with self-calibrating methods (P/B-ZAF, see ). Different approaches with and without reference to standards are commonly used and supported by the QUANTAX software. They are described in more detail in the next sections. Automatic and interactive operation. Fully automatic spectrum analysis is used in routine analysis in industry as well as in many laboratories. The input necessary for controlling the analysis is contained in filed method settings, provided by the vendor or user.