Transcription of Analysis of Selected Data from the Annual Fin. and Budget ...
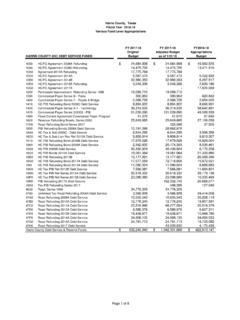
1 Analysis of Selected Data from the Annual Fin. and Budget Report (CCFS-311), Qtrly. Fin. Status Report (CCFS-311Q), and fiscal Data Abstract For the period FY 2011-12 to 2015-16. 520 Unrestricted GF-Col 2 Unrestricted GF - Fund 11, Col 1 Year-to-Year Change KERN Budgeted Actual Actual Actual Actual From 14/15 to 15/16 From 13/14 to 14/15 From 12/13 to 13/14 From 11/12 to 12/13. EDP. No. Acct Description 2015-16 2014-15 2013-14 2012-13 2011-12 $ Change % Change $ Change % Change $ Change % Change $ Change % Change 8100 Federal Revenues 638,607 592,139 644,442 723,253 473,284 46,468 (52,303) (78,811) 249,969 8600 State Revenues 68,725,285 57,585,079 55,013,530 42,658,367 52,019,336 11,140,206 2,571,549 12,355,163 (9,360,969) 8800 Local Revenues 60,226,583 55,207,683 56,811,226 58,858,770 49,549,860 5,018,900 (1,603,543) (2,047,544) 9,308,910 8900 Other Financing Soures 0 262,696 270,227 106,422 452,587 (262,696) (7,531) 163,805 (346,165)
2 801 Total Revenues 129,590,475 113,647,597 112,739,425 102,346,812 102,495,067 15,942,878 908,172 10,392,613 (148,255) 1000 Academic Salaries 47,633,629 46,697,387 44,138,074 44,570,354 45,115,691 936,242 2,559,313 (432,280) (545,337) 2000 Classified Salaries 22,360,244 19,733,641 18,504,115 18,333,697 19,025,496 2,626,603 1,229,526 170,418 (691,799) 3000 Employee Benefits 22,360,773 18,545,761 17,303,046 17,913,009 18,087,732 3,815,012 1,242,715 (609,963) (174,723) 4000 Supplies and Materials 2,130,233 1,799,665 1,752,423 1,494,516 1,189,715 330,568 47,242 257,907 304,801 5000 Other Operating Expenses and Services 13,601,261 13,396,870 15,449,997 9,639,141 10,529,707 204,391 (2,053,127) 5,810,856 (890,566) 6000 Capital Outlay 5,095,317 2,261,535 1,511,893 779,791 1,806,488 2,833,782 749,642 732,102 (1,026,697) 7000 Other Outgo 7,228,079 9,217,985 7,572,756 8,811,647 8,178,917 (1,989,906) 1,645,229 (1,238,891) 632,730 501 Total Expenditures 120,409,536 111,652,844 106,232,304 101,542,155 103,933,746 8,756,692 5,420,540 4,690,149 (2,391,591)
3 201 Excess/(Deficiency) of Rev. over Expenditures 9,180,939 1,994,753 6,507,121 804,657 (1,438,679) 7,186,186 (4,512,368) 5,702,464 2,243,336 901 Net Increase/(Decrease) in Fund Balance 9,180,939 1,994,753 6,507,121 804,657 (1,438,679) 7,186,186 (4,512,368) 5,702,464 2,243,336 902 Net Beginning Balance, July 1 34,390,999 31,371,959 25,526,565 24,987,655 27,243,085 3,019,040 5,845,394 538,910 (2,255,430) 903 Prior Year Adjustment 0 1,024,287 (661,727) (265,747) (816,751) (1,024,287) 1,686,014 (395,980) 551,004 904 Adjusted Beginning Balance 34,390,999 32,396,246 24,864,838 24,721,908 26,426,334 1,994,753 7,531,408 142,930 (1,704,426) 905 Ending Balance, June 30 43,571,938 34,390,999 31,371,959 25,526,565 24,987,655 9,180,939 3,019,040 5,845,394 538,910 2015-16 2014-15 2013-14 2012-13 2011-12 % Change % Change % Change % Change Fund Balance % [905/501] Required Fund Balance to meet 5% threshhold 6,020,477 5,582,642 5,311,615 5,077,108 5,196,687.
4 Over/(Under) 5%threshold 37,551,461 28,808,357 26,060,344 20,449,457 19,790,968. From 14/15 to 15/16 From 13/14 to 14/15 From 12/13 to 13/14 From 11/12 to 12/13. FTES: 2014-15 2013-14 2012-13 2011-12 $ Change % Change $ Change % Change $ Change % Change $ Change % Change FTES-Resident 19,917 19,857 19,130 18,580 18,938 60 727 550 (358) FTES-Nonresident 174 185 185 193 (12) 0 (8) Total FTES 20,031 19,316 18,765 19,131 715 551 (366) 50 % Law: 2015-16 2015-16 2014-15 2013-14 2012-13 $ Change % Change $ Change % Change $ Change % Change Instruction Salary Costs 48,110,269 45,507,738 46,925,311 46,916,460 2,602,531 (1,417,573) 8,851 Current Expense of Education 93,556,003 90,972,834 86,665,634 88,230,730 2,583,169 4,307,200 (1,565,096) % of Instructional Salary Costs to CEE 50% Requirement 46,778,002 45,486,417 43,332,817 44,115,365.
5 Over/(Under) 50% Requirement 1,332,268 21,321 3,592,494 2,801,095. % Change % Change % Change % Change Salaries and Benefits as a % of Total Expenditures 2015-16 1st Qtr 2014-15 4th Qtr 2013-14 4th Qtr 2012-13 4th Qtr 2011-12 4th Qtr From 14/15 to 15/16 From 13/14 to 14/15 From 12/13 to 13/14 From 11/12 to 12/13. GF Cash balance (unrestricted and restricted: 311Q Report 311Q Report 311Q Report 311Q Report 311Q Report $ Change % Change $ Change % Change $ Change % Change $ Change % Change Cash Balance per 311Q (excluding investments) 24,671,104 49,857,942 22,866,794 22,613,613 9,610,948 (25,186,838) 26,991,148 253,181 13,002,665)