Transcription of Analytic Geometry - Whitman College
1 1 Analytic GeometryMuch of the mathematics in this chapter will be review for you. However, the exampleswill be oriented toward applications and so will take some the (x, y) coordinate system we normally write thex-axis horizontally, with positivenumbers to the right of the origin, and they-axis vertically, with positive numbers abovethe origin. That is, unless stated otherwise, we take rightward to be the positivex-direction and upward to be the positivey-direction. In a purely mathematical situation,we normally choose the same scale for thex- andy-axes.
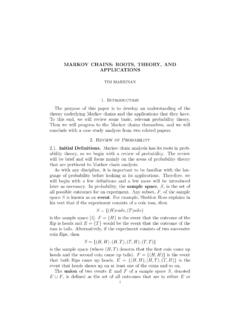
2 For example, the line joining theorigin to the point (a, a) makes an angle of 45 with thex-axis (and also with they-axis).In applications, often letters other thanxandyare used, and often different scales arechosen in the horizontal and vertical directions. For example, suppose you drop somethingfrom a window, and you want to study how its height above the ground changes fromsecond to second. It is natural to let the lettertdenote the time (the number of secondssince the object was released ) and to let the letterhdenote the height. For eacht(say,at one-second intervals) you have a corresponding heighth.
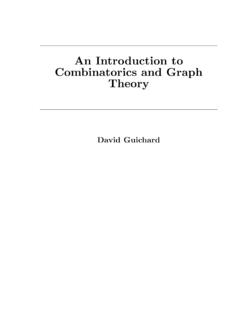
3 This information can betabulated, and then plotted on the (t, h) coordinate plane, as shown in figure use the word quadrant for each of the four regions into which the plane isdivided by the axes: the first quadrant is where points have both coordinates positive,or the northeast portion of the plot, and the second, third, and fourth quadrants arecounted off counterclockwise, so the second quadrant is the northwest, the third is thesouthwest, and the fourth is the we have two pointsAandBin the (x, y)-plane. We often want to know thechange inx-coordinate (also called the horizontal distance ) in going fromAtoB.
4 This1314 Chapter 1 Analytic Figure data plot, height versus often written x, where the meaning of (a capital delta in the Greek alphabet) is change in . (Thus, xcan be read as change inx although it usually is read as deltax . The point is that xdenotes a single number, and should not be interpreted as deltatimesx .) For example, ifA= (2,1) andB= (3,3), x= 3 2 = 1. Similarly, the change iny is written y. In our example, y= 3 1 = 2, the difference between they-coordinates of the two points. It is the vertical distance you have to move in going fromAtoB.
5 The general formulas for the change inxand the change inybetween a point(x1, y1) and a point (x2, y2) are: x=x2 x1, y=y2 that either or both of these might be we have two pointsA(x1, y1) andB(x2, y2), then we can draw one and only one linethrough both points. By theslopeof this line we mean the ratio of yto x. The slopeis often denotedm:m= y/ x= (y2 y1)/(x2 x1). For example, the line joining thepoints (1, 2) and (3,5) has slope (5 + 2)/(3 1) = 7 to the 1990 federal income tax schedules, a headof household paid 15% on taxable income up to $26050.
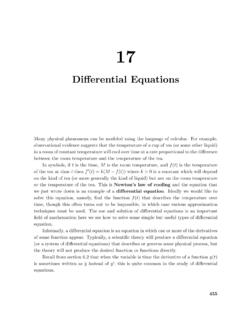
6 If taxable income was between$26050 and $134930, then, in addition, 28% was to be paid on the amount between $26050and $67200, and 33% paid on the amount over $67200 (if any). Interpret the tax Lines15information (15%, 28%, or 33%) using mathematical terminology, and graph the tax onthey-axis against the taxable income on percentages, when converted to decimal values , , and , are theslopesof the straight lines which form the graph of the tax for the corresponding tax tax graph is what s called apolygonal line, , it s made up of several straight linesegments of different slopes.
7 The first line starts at the point (0,0) and heads upwardwith slope ( , it goes upward 15 for every increase of100 in thex-direction), untilit reaches the point abovex= 26050. Then the graph bends upward, , the slopechanges to As the horizontal coordinate goes fromx= 26050 tox= 67200, the linegoes upward 28 for each 100 in thex-direction. Atx= 67200 the line turns upward againand continues with slope See figure Figure vs. most familiar form of the equation of a straight line is:y=mx+b. Heremis theslope of the line: if you increasexby 1, the equation tells you that you have to increaseybym.
8 If you increasexby x, thenyincreases by y=m x. The numberbis calledthey-intercept, because it is where the line crosses they-axis. If you know two pointson a line, the formulam= (y2 y1)/(x2 x1) gives you the slope. Once you know a pointand the slope, then they-intercept can be found by substituting the coordinates of eitherpoint in the equation:y1=mx1+b, ,b=y1 mx1. Alternatively, one can use the point-slope form of the equation of a straight line: startwith (y y1)/(x x1) =mandthen multiply to get (y y1) =m(x x1), the point-slope form. Of course, this may befurther manipulated to gety=mx mx1+y1, which is essentially the mx+b is possible to find the equation of a line between two pointsdirectly from the relation(y y1)/(x x1) = (y2 y1)/(x2 x1), which says the slope measured between the point(x1, y1) and the point (x2, y2) is the same as the slope measured between the point (x1, y1)16 Chapter 1 Analytic Geometryand any other point (x, y) on the line.
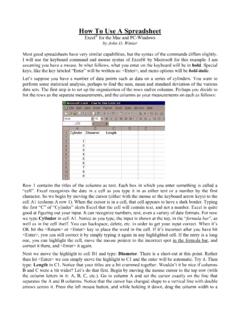
9 For example, if we want to find the equation ofthe line joining our earlier pointsA(2,1) andB(3,3), we can use this formula:y 1x 2=3 13 2= 2,so thaty 1 = 2(x 2), ,y= 2x course, this is really just the point-slope formula, except that we are not computingmin a separate slopemof a line in the formy=mx+btells us the direction in which the line ispointing. Ifmis positive, the line goes into the 1st quadrant as you go fromleft to large and positive, it has a steep incline, while ifmis small and positive, then theline has a small angle of inclination. Ifmis negative, the line goes into the 4th quadrantas you go from left to right.
10 Ifmis a large negative number (large in absolute value), thenthe line points steeply downward; while ifmis negative but near zero, then it points onlya little downward. These four possibilities are illustrated in figure 4 2024 4 2 0 2 4 2024 4 2 0 2 4 2024 4 2 0 2 4 2024 4 2 0 2 4 Figure with slopes 3, , 4, and 0, then the line is horizontal: its equation is simplyy= is one type of line that cannot be written in the formy=mx+b, namely,vertical lines. A vertical line has an equation of the formx=a. Sometimes one says thata vertical line has an infinite it is useful to find thex-intercept of a liney=mx+b.