Transcription of How to Use Excel
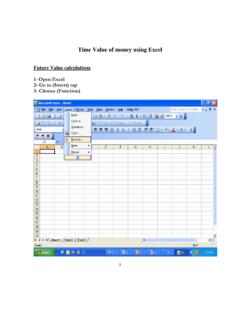
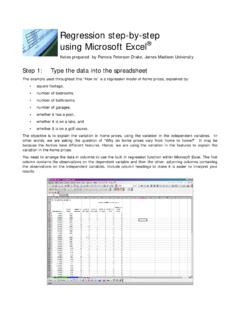
1 how to use A Spreadsheet Excel for the Mac and PC-Windows by John D. Winter Most good spreadsheets have very similar capabilities, but the syntax of the commands differs slightly. I will use the keyboard command and mouse syntax of Excel by Microsoft for this example. I am assuming you have a mouse. In what follows, what you enter on the keyboard will be in bold. Special keys, like the key labeled Enter will be written as: <Enter>, and menu options will be bold-italic. Let s suppose you have a number of data points such as data on a series of cylinders. You want to perform some statistical analysis, perhaps to find the sum, mean and standard deviation of the various data sets.
2 The first step is to set up the organization of the rows and/or columns. Perhaps you decide to list the rows as the separate measurements, and the columns as your measurements on each as follows: Row 1 contains the titles of the columns as text. Each box in which you enter something is called a cell . Excel recognizes the data in a cell as you type it in as either text or a number by the first character. So we begin by moving the cursor (either with the mouse or the keyboard arrow keys) to the cell A1 (column A row 1). When the cursor is in a cell, that cell appears to have a dark border.
3 Typing the first C of Cylinder alerts Excel that the cell will contain text, and not a number. Excel is quite good at figuring out your input. It can recognize numbers, text, even a variety of date formats. For now we type Cylinder in cell A1. Notice as you type, the input is shown at the top, in the formula bar , as well as in the cell itself. You can backspace, delete, etc. in order to get your input correct. When it s OK hit the <Return> or <Enter> key to place the word in the cell. If it s incorrect after you have hit <Enter>, you can still correct it by simply typing it again in any highlighted cell.
4 If the entry is a long one, you can highlight the cell, move the mouse pointer to the incorrect spot in the formula bar, and correct it there, and <Enter> it again. Next we move the highlight to cell B1 and type: Diameter. There is a short-cut at this point. Rather than hit <Enter> we can simply move the highlight to C1 and the enter will be automatic. Try it. Then type: Length in C1. Notice that your titles are a bit crammed together. Wouldn t it be nice if columns B and C were a bit wider? Let s do that first. Begin by moving the mouse cursor to the top row (with the column letters in it: A, B, C, etc.)
5 Go to column A and set the cursor exactly on the line that separates the A and B columns. Notice that the cursor has changed shape to a vertical line with double arrows across it. Press the left mouse button, and while holding it down, drag the column width to a 2 size that will contain the title and leave a bit of space on the sides. Release the mouse button when you re satisfied. Do the same for columns B and C. Excel also has a nice feature that makes column widths fit automatically, after you ve entered all the data: Format/Column/AutoFit Selection.
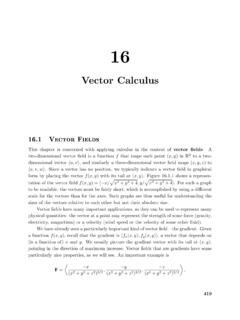
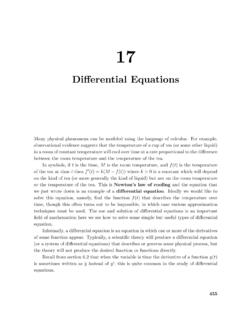
6 The preceeding syntax means to choose the menu items at the top of the spreadsheet in sequence. Click the left mouse button first on the word File at the top left, then choose the Column option, and finally choose AutoFit Selection. Now move the highlight to cell A3. Type the numbers 1-9 for the cylinders you measure down the column A to complete the organization. If you make any mistakes, simply type the new data over the old. Your spreadsheet should look like the figure above. Next enter the data so that the spreadsheet looks like this: Notice a couple of things at this point.
7 Text aligns to the left margin of the cells ( left-justified ) while numbers are right-justified. This makes things look a little messy and we will fix these cosmetic things later. Also, typing in B11 results in a 4 . Excel takes only the number of significant digits that it thinks you intend. We can treat this later as well. First let s get some statistics on our data. Move the highlight to cell B13. Let s determine the sum of column B. Operations like sum, mean, etc are called functions . Functions are listed in the manual for Excel , but can also be found using the Help command in the upper right part of the menu bar.
8 We want SUM, so we type: =SUM(B3:B11) in cell B13 (case doesn t matter). You must enter the = sign first, which signals Excel that you are about to enter a formula, and not a name or number. The colon means that you are specifying a range of cells, in this case the sum of rows 3 through 11 in column B. Hit <Enter> and you have it. Some fun, huh? Move the highlight to B14 and type: =average(B3:B11) to get the mean. Do this in lower case. Watch the entry in the formula bar at the top of the spreadsheet. When you hit the <Enter> key, the formula in the bar at the top changes average to upper case.
9 This means that Excel recognized your entry as an Excel function. It left Cylinder as it was entered before, since that isn t a function. This is a nice feature, and I always enter my functions in lower case, letting Excel tell me if I entered them correctly when it changes to upper case. Let s do a standard deviation too, but in a different manner. Type only: =stdevp( in cell B15 for the standard deviation, but do not yet hit <Enter>. Now move the mouse cursor to cell B3, hold down the left button, and drag the highlight to cell B11. Note that it now says =stdevp(B3:B11 in the bar at the top.))
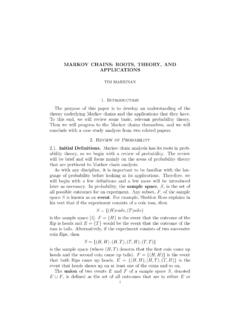
10 Just move the cursor to the upper function bar and add the right parenthesis and hit <Enter>. Excel will then create the standard deviation for the column of data in cell B11. 3 In order to know what your values are, you should type: Sum in cell A13, Mean in A14, and S. Dev. in A15. The sheet will now look like: Explore the spreadsheet for a moment here. Move the highlight around from cell to cell, and notice that the cell contents are always shown in the formula bar at the top of the spreadsheet. It tells you what s in the highlighted cell. When you highlight cell B11, you see a 4 in this line.