Example: bachelor of science
Time Value of money using Excel - KFUPM
Time Value of money using Excel Future Value calculations 1- Open Excel 2- Go to (Insert) tap 3- Choose (Function) 2 4- In the (insert function) box ... When the function argument box open, use the cell selector button to choose the relevant variables. 20 For cash …
Tags:
Information
Domain:
Source:
Link to this page:
Documents from same domain
William Stallings Data and Computer …
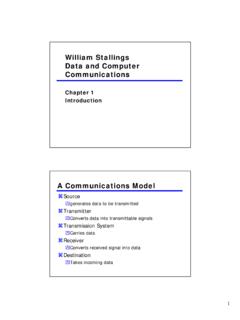
faculty.kfupm.edu.sa1 William Stallings Data and Computer Communications Chapter 1 Introduction A Communications Model Source generates data to be transmitted Transmitter
William Stallings Data and Computer …
faculty.kfupm.edu.sa1 William Stallings Data and Computer Communications 7th Edition Chapter 4 Transmission Media Overview • Guided - wire • Unguided - wireless • Characteristics and quality determined by

Reinforced Concrete - KFUPM
faculty.kfupm.edu.saAmong these three, reinforced concrete is more commonly used in constructing buildings, bridges, ...
Dielectric loss - KFUPM
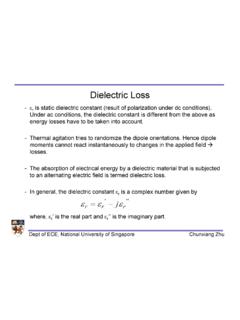
faculty.kfupm.edu.saDept of ECE, National University of Singapore Chunxiang Zhu Dielectric Loss - ε r is static dielectric constant (result of polarization under dc conditions). Under ac conditions, the dielectric constant is different from the above as

Protective Coatings - KFUPM
faculty.kfupm.edu.saCorrosion Prevention by Protective Coatings by C.G. Munger (NACE) 3. Corrosion Control by S.A. Bradford. KFUPM-ME 472 (062) Coatings and Lining 2

Chapter 4 MATERIAL BALANCES AND APPLICATIONS
faculty.kfupm.edu.sa1 MATERIAL BALANCES AND APPLICATIONS 4.1. Introduction Material balances are important first step when designing a new process or analyzing an
BarCharts, Inc. WORLD’S #1QUICK REFERENCE GUIDE
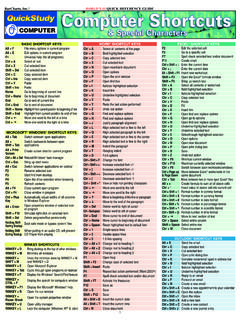
faculty.kfupm.edu.sa1 BarCharts, Inc.® WORLD’S #1QUICK REFERENCE GUIDE BASIC SHORTCUT KEYS Alt + F File menu options in current program Alt + E Edit options in current program F1 Universal help (for all programs)
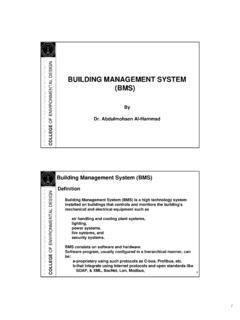
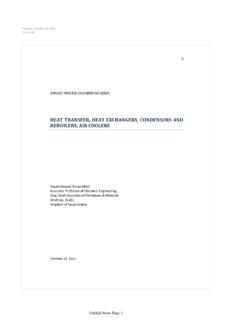
BUILDING MANAGEMENT SYSTEM (BMS) - KFUPM
faculty.kfupm.edu.sa3 COLLEGE 5 OF ENVIRONMENTAL DESIGN What is a Building Management System and how does it work? The BMS is a “stand alone” computer system that can …
Unfiled Notes Page 1 - KFUPM
faculty.kfupm.edu.saDesign of Reboiler and Vaporizers Reboilers and vaporizers have three types based and can be classified based on the nature of circulated fluid, …

Editorial diGESt Fundamentals of raman …
faculty.kfupm.edu.saEditorial diGESt Fundamentals of raman spectroscopy ... Raman spectroscopy is a form of molecular spectroscopy that involves ... Fundamentals of Raman spectroscopy::
Related documents

USING EXCEL SOLVER IN OPTIMIZATION PROBLEMS
archives.math.utk.eduwe demonstrate how to use Excel spreadsheet modeling and Solver to find the optimal solution of optimization problems. If the model has two variables, the graphical method can …

Practical Uses of Microsoft Excel
www.emsisd.comPractical Uses of Microsoft Excel 1 EM-S ISD Instructional Technology, 2008 This training is intended to provide you with the knowledge base that you need to use Microsoft Excel for day-to-day applications. Worksheets Worksheets are the pages that are used in an Excel workbook. Each Excel …
RESAMPLING USING EXCEL IN TEACHING STATISTICS
archives.math.utk.edu3. Sampling Distribution Using Excel Data Table Now we use Excel Data Table to generate the sampling distribution of mean and introduce the concepts.
Formulas & Functions in Microsoft Excel
biostat.mc.vanderbilt.eduExcel is a great tool to use for data collection and entry, and even to use for some derivation of other columns. However, Excel IS NOT the best tool to use to conduct advanced analyses, especially statistical analyses.

How to Use Excel for Data Entry - University of California ...
eds-courses.ucsd.eduExcel is a very popular tool for entering and manipulating data. This document shows you how to enter data that you can easily open in statistics packages such as SPSS or SAS.
Using Excel to Solve Business Problems - AI Applications
vaultanalytics.comPreparing to Use Excel 2007 Excel 2007 is used in the specific ‘How To’ sections, as it is the most ubiquitous piece of software with statistical capabilities.

Creating a Gradebook in Excel
eds-courses.ucsd.eduCreating a Gradebook in Excel Spreadsheets are a great tool for creating gradebooks. With a little bit of work, you can create a customized gradebook that will provide weighted scores and averages. The following instructions describe the steps for creating a spreadsheet gradebook.
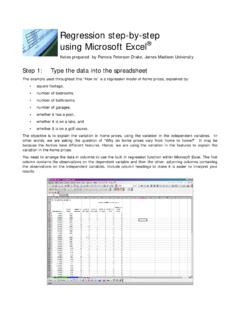
Regression step-by-step using Microsoft Excel
educ.jmu.eduStep 2: Use Excel®’s Data Analysis program, Regression In the Tools menu, you will find a Data Analysis option.1 Within Data Analysis, you should then choose Regression: Step 3: Specify the regression data and output You will see a pop-up box for the regression specifications.
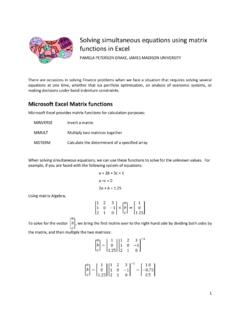
Solving simultaneous equations using matrix functions in Excel
educ.jmu.eduMicrosoft Excel provides matrix functions for calculation purposes: MINVERSE Invert a matrix MMULT Multiply two matrices together MDTERM Calculate the determinant of a specified array When solving simultaneous equations, we can use these functions to solve for the unknown values. For

Using Excel to Graph a Function - San Dieguito Union High ...
math.sduhsd.netUsing Excel to Graph a Function 1. Make the x-values. a. Type x in cell A1. b. Type 1 in cell A2 and type 2 in cell A3. c. Select cells A2 and A3 by clicking-and-dragging. Select the “formula drag” point in the lower right corner of the selection and drag this down until you have the values 1 through 15 showing.
Related search queries
USING EXCEL SOLVER IN OPTIMIZATION PROBLEMS, How to use Excel, Practical Uses of Microsoft Excel, Excel, RESAMPLING USING EXCEL IN TEACHING STATISTICS, Use Excel, Formulas & Functions in Microsoft Excel, How to Use Excel for Data Entry, Using Excel to Solve Business Problems, Creating a Gradebook in Excel, Using Excel to Graph a Function