Transcription of Using Excel to Solve Business Problems - AI Applications
1 Curtis Seare Copyright: Vault Analytics July 2010 Using Excel to Solve Business Problems : Simple Predictive Analytics 2 | Page Contents Section I: Background Information Why use Predictive Analytics? How to use this Guide Analysis Fundamentals Method for Creating Predictive Models Section II: Predictive Models How to Choose an Appropriate Model Regression Correlation Linear Regression Multivariate Exponential Regression Logarithmic Regression Polynomial Regression Time Series Logistic Regression ANOVA t-Test 1 Way ANOVA 2 Way ANOVA Chi-Square 3 | Page Why Use Predictive Analytics? Strategy Development Predictive analytics is an indispensible tool for strategy development. In any good strategy, there are three elements: a set of assumptions, a set of actions that need to be taken, and a set of desired outcomes. The outcomes are achieved as a result of the actions being executed and the assumptions being true.
2 In essence, we say: Assuming A is true, if we do B we will achieve C. Predictive analytics helps out with all three of the steps considered above. Statistical tests tell us if our assumptions are correct and predictive models fit to historic data help us quantify what the result will be with a given set of inputs. The value of having a statistically valid predictive model in strategy development is that you can know what you need to do to produce the best results. Further, simple predictive models are not above most people s abilities to produce. It requires some understanding of statistics, as well as various predictive modeling techniques. This guide provides you with both the statistical basics you need to know, as well as a process that can be followed to choose and implement an appropriate predictive modeling technique for your given situation. It stays admittedly away from many technicalities, so that focus can be placed just on the information that is necessary to get a predictive model built and in working order.
3 Example Business Questions Answered The reason we do predictive analytics is to Solve Business Problems . Accordingly, here are some example Business questions that can be answered with each of the predictive models described in this guide. Regression Correlation From a large database of demographical data, which factors are associated with response rates? From all the metrics on our website, which ones are associated with purchases on the site? From all the medical data collected in a patient sample, which factors are associated with blood pressure? Linear Regression If we send out x number of mail pieces to a target customer segment, how many sales will we get in return? If we sell x number of product A, how much can we expect to sell of product B? If x number of people sign up for this promotional program, how many extra sales can we expect?
4 Multivariate Linear Regression 4 | Page How many subscriptions can we expect to get by spending specific amounts of time in various social media marketing channels? What is the optimal word count, number of graphics, and number of topics covered in our weekly newsletter in order to get the most click-throughs? Exponential Regression Model what happens in a word of mouth marketing campaign builds slowly at first, but after a certain point it rises exponentially Model a learning curve at first, it takes a long time to perform a specific task on a new piece of software, but the more you do it, the time lowers to a constant level Logarithmic Regression Model the percentage of total expected calls that have come in after a mail campaign is executed - this percentage will grow quickly but taper off as time goes on Polynomial Regression What is the appropriate amount of customer contacts per month to maximize sales?
5 Where should we put the price in order to sell the maximum amount of a given product? Time Series How many sales are we likely to have in the next year? How much do the specific months of the year affect our close rates? Logistic Regression What is the probability that someone of a given age will respond to our marketing campaign? What is the probability that someone will purchase this product given a certain price? ANOVA t-Test Does gender affect the sales rate of our products? Does this medical treatment affect the blood pressure of our patients? Does this training course increase the efficiency of our staff? 1 Way ANOVA Compare the response rates of various customer segments to a specific marketing campaign, and then allocate more resources to the segment with the higher response Compare response rates of different variations of a mailer piece, and use the mailer that has the greatest response rate Compare sales conversion rates according to traffic referral information from your web analytics, and then focus on getting more traffic from the highest converting source 2 Way ANOVA 5 | Page What is the best combination of marketing channel and product offering to get the highest sales rates?
6 Chi-Square Out of all of our customer segments, which ones are the most likely to buy our products? Do our former assumptions about our customer segments still hold true? 6 | Page How to use this Guide This guide is designed to be as simple as possible, giving you the critical information you will need to create, use, and validate various simple predictive models. First, some analysis fundamentals are provided. These are the basics of doing good and accurate analysis, and it will be important to keep these principles in mind as you create predictive models. Second, a process is provided that will allow you to follow some easy, predefined steps to creating your own predictive models. This is a big-picture process flow meant to give you a basic procedure to follow no matter what type of predictive model you need to create. Last, the guide gives you an in-depth look into various predictive modeling techniques, organized according to the type of data you have and the type of question you re trying to answer.
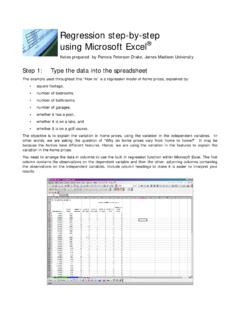
7 This section makes up the bulk of the book, and each of the models is explained by telling you what the predictive model looks like, what it can be used for, the assumptions necessary to use the model, a process to follow to create it (including step by step instructions is you are Using Excel 2007), an explanation of some common errors to watch for, a section on analyzing your results, and a section listing a nonparametric counterpart test to use if the conditions for normality are not met in the data. Preparing to Use Excel 2007 Excel 2007 is used in the specific How To sections, as it is the most ubiquitous piece of software with statistical capabilities. Excel is admittedly limited in these statistical capabilities, but affords the basic functionality necessary to create and validate simple predictive models. Two add-ins are used throughout this guide to aid in doing the necessary statistical tests for each predictive model.
8 They are the Data Analysis Toolpak and the Solver Add-in. These add-ins come with Excel 2007, but you must activate them before you can use them. To activate both of them, simply go to the home menu and click Excel Options 7 | Page Next, click on the Add-Ins section on the left side, and click Go.. Lastly, check the Analysis ToolPak and Solver Add-in check boxes, and click OK 8 | Page Analysis Fundamentals Although an entire book could be written about the fundamentals of good analysis, here we will cover just two fundamentals that are the most critical. These two basics are seeing the data in context and segmentation. Seeing the Data in Context Understanding what the data are telling you within the context of the Business situation being analyzed is extremely important. This will help you avoid making faulty conclusions and keep your analysis appropriate for the Business question being answered.
9 The best way to learn this fundamental is to see it in action, so we will take an example. We will look at a type of direct mail campaign analysis. We want to know how many calls are expected to come into our call center after we execute the campaign. First, we take some historical data showing us the percentage of total calls coming in according to the number of days after starting a mail campaign, shown below. After creating a scatter plot of the data, we try to fit a logarithmic regression line as a model, shown seen below. Even though the R2 tells us that the fit is good, the model may not be the best way to explain this data when the context and purpose of this analysis are considered. We want the model to be able to predict what percentage of total calls will come in from a mailing campaign so we can staff the call y = (x) + = | Page center. If I were to use the line above as the model, I would be predicting low values for incoming calls between about day 20 and 100, and high values thereafter.
10 Because of this error, we would not be staffing the call center correctly. To create a better model, I would consider the fact that, in this context, it is not necessary to fit a trend model to the entire data set. Consider the following model, which can be used to predict the percentage of total calls coming in between days 4 and 35 after the mailing campaign: You will notice that this trend model does not contain the same high and low errors as the previous model did. Further, upon doing some calculations on the data in the spreadsheet, we know that anything before day 4 makes up for just 8% of all calls, and anything after day 35 makes up for just 15% of all calls. I have highlighted with a model the time period of the biggest growth to the call percentage, while summarizing the remaining percentages on either side. This will give just the right amount of information needed to staff the call center, while minimizing errors I would have made trying to fit a single trend model to the data.