Transcription of Annual Deer Population Report & 2021-22 Antlerless License ...
1 Annual Deer Population Report &. 2021-22 Antlerless License Allocations Recommendations March 31, 2021. Pennsylvania Game Commission Bureau of Wildlife Management Deer and Elk Section 2. Summary of 2021-22 Antlerless Allocations to Achieve Deer Plan Goals Deer Plan 2020-21 2021-22 Deer Plan Population WMU Population Approved Recommendation Comments Trend Objective Allocation (14-day Concurrent). 1A Stable Stabilize 49,000 40,000 Change of 1 week to 2 weeks concurrent. 1B Stable Stabilize 41,000 32,000 Change of 1 week to 2 weeks concurrent. 2A Stable Stabilize 46,000 39,000 Change of 1 week to 2 weeks concurrent. 2B Stable Stabilize 49,000 49,000 No change. Maintaining the increased harvest by Antlerless 2C Stable Reduce 58,000 67,000 deer/mi2 to reduce Population because of CWD. Maintaining the increased harvest by Antlerless 2D Stable Reduce 60,000 74,000 deer/mi2 to reduce Population because of CWD.
2 Maintaining the increased harvest by Antlerless 2E Stable Reduce 39,000 42,000 deer/mi2 to reduce Population because of CWD. Increase harvest by Antlerless deer/mi2 to stop 2F Increasing Stabilize 36,000 32,000 Population growth. Change of 1 week to 2 weeks concurrent. 2G Stable Stabilize 27,000 23,000 Change of 1 week to 2 weeks concurrent. Increase harvest by Antlerless deer/mi2 to stop 2H Increasing Stabilize 7,000 9,000 Population growth. Change of 1 week to 2 weeks concurrent. 3A Stable Stabilize 21,000 19,000 Change of 1 week to 2 weeks concurrent. 3B Stable Stabilize 33,000 30,000 Change of 1 week to 2 weeks concurrent. 3C Stable Stabilize 49,000 33,000 Change of 1 week to 2 weeks concurrent. Increase harvest by Antlerless deer/mi2 to reduce 3D Increasing Reduce 36,000 36,000 Population because of forest impacts.
3 Change of 1 week to 2 weeks concurrent. Increase harvest by Antlerless deer/mi2 to reduce 4A Stable Reduce 49,000 50,000 Population because of CWD (CWD prevalence goals are not being met in the established area). Maintaining the increased harvest by Antlerless 4B Decreasing Reduce 33,000 34,000 deer/mi2 to reduce Population because of CWD. 4C Stable Stabilize 32,000 29,000 Change of 1 week to 2 weeks concurrent. Maintaining the increased harvest by Antlerless 4D Stable Reduce 45,000 55,000 deer/mi2 to reduce Population because of CWD. Increase harvest by Antlerless deer/mi2 to reduce 4E Stable Reduce 37,000 42,000 Population because of forest impacts and CWD (new). Change of 1 week to 2 weeks concurrent. Maintaining the increased harvest by Antlerless 5A Stable Reduce 26,000 31,000 deer/mi2 to reduce Population because of CWD.
4 Change of 1 week to 2 weeks concurrent (based on history 5B Stable Stabilize 60,000 60,000 of this WMU, minimal increase in License efficiency expected). 5C Stable Stabilize 70,000 70,000 No change. 5D Stable Stabilize 29,000 29,000 No change. 3. Data presented in this Report represent collaborative efforts between the Forest Service, Pennsylvania's Department of Conservation and Natural Resources, the Pennsylvania Cooperative Fish and Wildlife Research Unit at Penn State University, Responsive Management, and the Game Commission's bureaus of Information and Education, Wildlife Habitat Management, and Wildlife Management. For more information on the deer management program and data and methods used to assess progress towards management goals, visit the Game Commission's website, , to find the 2009-2018 White-tailed Deer Management Plan.
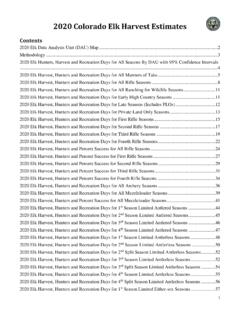
5 Deer Management Goals Deer management goals direct Game Commission staff in formulating deer management recommendations. Current management goals that directly affect Antlerless allocations are to manage deer for healthy deer, healthy forest habitat, and acceptable levels of deer-human conflicts. These goals were identified by a group of public stakeholders in 2002 and continue to be supported by a clear majority of Pennsylvania citizens and hunters (Figure 1). Public Support for Deer Management Goals 100%. 90%. 80%. Percent Support 70%. 60%. 50%. 40%. 30%. 20%. 10%. 0%. Deer Health Forest Health Deer-Human Conflicts Hunters Public Figure 1. Percent of respondents that agree with deer management goals. The citizen survey was completed by Responsive Management in the fall of 2011, and the deer hunter survey was completed by the Deer and Elk Section and Bureau of Wildlife Management in the fall of 2020.
6 4. Step-by-Step Deer Management Recommendation Guide The deer management program considers data for each goal to arrive at a deer Population recommendation in a defined process (see pages 7 and 8). This process has been revised as new data are incorporated into the program and will continue to evolve as more data and understanding are gained. Decision points ( , fawn to doe ratio declining?) are based on published protocols from the wildlife and forestry professions. Do PA residents want fewer or more deer? This question is answered using results of the survey conducted by Responsive Management of Pennsylvania residents in 2019. If most surveyed residents in a WMU want less deer, the recommendation would be to reduce the deer Population . If the deer health goal is met, forest habitat is good, and WMU residents want more deer, the recommendation would be to increase the deer Population .
7 Is CWD present in free-ranging deer? This question is answered using results from the thousands of deer tested annually for chronic wasting disease (CWD). If CWD is present in free-ranging deer, then management recommendations are to stabilize or reduce WMU populations. Additional Antlerless deer can be removed using Deer Management Assistance Program permits in accordance with the CWD. response plan. Increasing the Antlerless harvest serves 2 purposes that are important to efforts to contain CWD; (1) increased Antlerless harvest removes more deer from the Population and allows the Game Commission to test more deer in our efforts to obtain the best information on the extent of the disease, and (2) increased Antlerless harvest can reduce deer populations and spread of CWD. Is fawn to doe ratio declining?
8 This question is answered using results from the age structure of the Antlerless harvest. These data are collected each year by trained Game Commission deer agers from across the state. If the proportion of fawns in the Antlerless harvest (hereafter referred to as fawn to doe ratio) is declining and the Population is not achieving its objective ( , Population is declining and objective is to maintain a stable deer Population ), then the Antlerless allocation would be reduced to stop the Population decline. The Antlerless harvest will have the greatest influence on the Population because hunting accounts for most deer mortalities in Pennsylvania. If the fawn to doe ratio is stable or if the Population is meeting its objective ( , Population is stable and objective is stable), no management action is taken.
9 Has deer Population been stable or increasing for 6 years? This question is answered using results from the Pennsylvania Sex-Age-Kill deer Population model and deer harvest indices ( , antlered harvest, Antlerless catch-per-unit-effort). The 6-year time period is necessary because of the 5-year time period to collect the forest data. The sixth 5. year is added because only 2nd year seedlings are counted in the forest data. As a result, a complete forest data set includes effects of deer from the previous 6 years. If the deer Population is decreasing the recommendation is to stabilize the Population at the lower level to see if forest habitat improves given the lower deer Population . If the deer Population is stable or increasing, the process continues to the next step. Is forest habitat good? This question is answered using results from the Pennsylvania Regeneration Study.
10 If 70% of forested plots have adequate regeneration, forest habitat is considered good. If less than 50% of forested plots have adequate regeneration, forest habitat is considered poor. If 50% to 70% of forested plots have adequate regeneration, forest habitat is considered fair. Is plot to plot regeneration improving? This question is answered using results from the Pennsylvania Regeneration Study. In this step, results from individual plots are compared in a paired analysis. For example, plot measurements from 2005 are compared to their remeasured results in 2010 to see if regeneration has improved on individual plots. All plots with 2 measures are included in this analysis. If regeneration is improving, then the deer Population trend can be stabilized. If regeneration is not improving, the process continues to the next step.