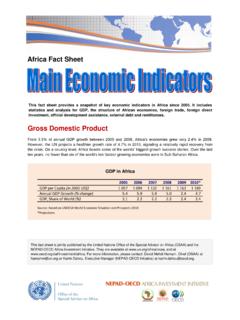
Transcription of Annual Gross Domestic Product
1 GHANA STATISTICAL SERVICES tatistics for Development and ProgressSeptember 2015 EditionGhana Statistical Service (GSS) Box GP 1098, DomesticProduct The following symbols and abreviations are used in the tables:0 Less than half the digit shown-Nil or no value will be available laterxCell blocked for logical reasonsGh Ghana CediUS$US elsewhere specifiedWhere figures have been rounded up, the total may not match the sum of the rounded constituent technical enquiries contact:Ghana Statistical Service (GSS), Head OfficeEconomic Statistics DirectorateTel No: +233-24-3628234 Email: of ContentsPageIntroduction3 Key findings3 Memorandum items3 Table : Gross Domestic Product (GDP) at Current Market Prices by Economic Activity (Gh Million)4 Table : Distribution of Gross Domestic Product (at Basic Prices) by Economic Activity (percent)5 Table : Gross Domestic Product (GDP) at 2006 Prices by Economic Activity (Gh Million)6 Table : Growth Rates of Gross Domestic Product at 2006 Constant Prices (percent7 Table : NON-OIL GDP at Current Market Prices by Economic Activity (Gh Million)8 Table : Distribution of Non-Oil GDP (at Basic Prices) by Economic Activity (percent)8 Table : NON-OIL GDP at 2006 Constant Prices by Economic Activity (Gh Million)9 Table.)
2 Growth Rates of NON-OIL GDP at 2006 Constant Prices (percent)9 INTRODUCTIONG ross Domestic Product is the estimate of the total value of final goods and services produced in the country over a given a estimation of the Gross Domestic Product (GDP) is done in stages, with estimates generated at each stage being dependent on available data. Estimates from each stage are progressively designated as provisional, revised and release contains the provisonal 2015 GDP estimates, revised 2014 estimates and final estimates for 2006 to 2013. The estimates for 2014 used data covering four quarters of the year from production units representing data for the whole year. The 2015 provisional estimates are estimations based on two quarters of 2015 with underlying assumptions.
3 Further revisions to these estimates will be carried out in December FINDINGSP rovisional GDP estimates for 2015 showed a growth of percent over the 2014 revised estimates. The Industry sector recordedthe highest growth of percent, followed by Services ( ) and the Agriculture sector with a growth of remain the largest sector. Its share of GDP increased from percent in 2014 to percent in 2015. The sector's growth rate however decreased from percent in 2014 to percent in 2015. Two of the subsectors in this sector recorded growth ratesabove 15 percent. These are the Financial and Insurance subsector ( ) and the Public Administration and Defence; Social Security Services the Agriculture sector, the least growing sector with a share of percent, growth rates declined from percent in 2014 to percent in 2015.
4 Of all the Agriculture activities the Livestock subsector recorded the highest growth of percent in is the largest activitity within the Industry sector with a growth of percent and a share of percent of nominal GDP. The share of Industry sector inched up slightly from percent in 2014 to percent in Non-Oil Annual GDP growth rate expanded from percent in 2014 to percent in 2015. The 2015 Non-oil GDP for theIndustry grew from percent in 2014 to percent in 2015. The Agriculture sector contracted from percent in 2014 to percent in 2015 and the Services sector from percent in 2014 to percent in is the second largest activity in the economy with a share of percent of nominal GDP at basic ItemsEconomic Aggregate20102011201220132014* 2015** Population estimate (million) Exchange rate ( /$) GDP current (million Gh )46,042 59,816 75,315 93,416 113,343 140,047 Non-Oil GDP current (million Gh )
5 45,865 56,070 69,666 85,974 105,550 131,957 GDP current (million US$)32,186 39,517 41,656 48,654 38,552 36,657 Per capita GDP (Gh )1,867 2,370 2,916 3,535 4,192 5,061 Per capita GDP (US$)1,305 1,566 1,613 1,841 1,426 1,325 Growth Rates% GDP at current market GDP at constant 2006 Non-Oil GDP at constant 2006 Change in GDP *Revised ** ProvisionalFINALIZED 2006 TO 2013 Annual GDP, 2014 REVISED GDP AND PROVISIONAL 2015 GDP ESTIMATES3 Table.
6 Gross Domestic Product (GDP) at Current Market Prices by Economic Activity (Gh Million)20062007200820092010201120122013 2014*2015** ,415 6,320 8,875 11,343 12,910 14,155 16,668 20,232 23,278 25,430 ,794 4,409 6,435 8,425 9,422 10,650 12,525 15,742 18,144 19,471 o/w. Cocoa537 581 706 874 1,392 1,996 1,869 1,981 2,409 2,817 501 606 729 873 1,004 1,162 1,223 1,318 1,541 and Logging736 910 1,072 1,314 1,614 1,549 1,880 2,019 2,537 2,881 500 762 874 1,001 952 1,102 1,249 1,279 1,537 ,704 4,513 5,855 6,776 8,294 14,274 20,438 25,113 28,767 35,957 and Quarrying497 602 693 740 1,013 4,690 6,961 8,503 8,640 8,562 o/w.
7 Oil**0 0 0 0 178 3,746 5,649 7,441 7,793 8,091 ,823 1,990 2,277 2,478 2,941 3,842 4,263 4,800 5,342 6,229 143 130 155 167 266 280 332 393 443 551 and Sewerage224 227 229 246 368 467 511 568 576 799 ,016 1,564 2,500 3,144 3,706 4,995 8,370 10,848 13,766 19,817 ,690 10,922 13,935 17,543 22,184 27,423 35,837 44,964 56,248 72,428 ; Repair Of Vehicles, Household Goods1,141 1,335 1,710 2,109 2,701 3,282 4,060 5,222 6,085 7,776 and Restaurants894 1,210 1,716 2,196 2,593 3,007 3,517 5,256 6,099 7,020 and Storage2,357 2,849 3,262 3,758 4,578 5,997 8,041 10,149 13,351 15,517 and Communication483 511 622 657 831 989 1,590 1,572 2,441 3,178 and Insurance activities473 739 1,089 1,547 2,240 2,466 3,452 5,885 9,115 13,772 Estate, Professional, Administrative & Support Service activities914 1,018 1,185 1,462 1,945 2,591 3.
8 502 3,485 3,894 5,066 Administration Social Security862 1,289 1,799 2,479 3,024 3,897 4,952 5,305 5,843 7,803 856 1,132 1,506 1,877 2,307 3,101 3,248 3,883 5,266 and Social Work250 308 381 513 674 728 921 956 1,091 1,501 , Social & Personal Service Activities662 807 1,039 1,318 1,722 2,159 2,701 3,886 4,445 5,529 FISIM (Financial Intermediation Services Indirectly Measured)**407 503 689 1,192 1,512 1,458 2,317 2,919 4,354 7,014 Domestic Product at basic prices17,403 21,252 27,975 34,470 41,876 54,394 70,627 87,390 103,939 126,801 Net indirect Taxes1,302 1,902 2,204 2,128 4,166 5,422 4,689 6,026 9,404 13,246 Domestic Product in purchasers' value18,705 23,154 30,179 36,598 46,042 59,816 75,315 93, 113,343 140,047 *Revised** Provisional** FISIM is a negative ** Oil means Oil and Gas 4 Table.
9 Distribution of Gross Domestic Product (at Basic Prices) by Economic Activity (percent)2006200720082009201020112012201 32014*2015** o/w. and and o/w. Oil** and.
10 Repair Of Vehicles, Household and and and and Insurance Estate, Professional, Administrative & Support Service Administration Social And Social , Social & Personal Service Domestic Product at basic *Revised** Provisional**Oil means Oil and Gas 5 Table : Gross Domestic Product (GDP) at 2006 Prices by Economic Activity (Gh Million)20062007200820092010201120122013 2014*2015** ,415 5,322 5,716 6,129 6,453 6,507 6,657 7,035 7,362 7,365 ,794 3,743 4,064 4,479 4,703 4,878 4,915 5,204 5,499 5,406 o/w.

