Transcription of Application Note Human PBMC Isolation and Counting Using ...
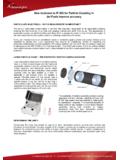
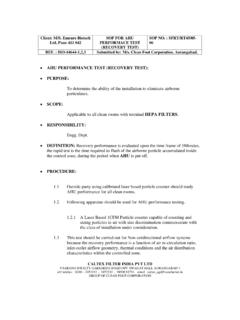
1 Application Note Human PBMC Isolation and Counting Using the Scepter Handheld Automated Cell Counter Introduction Post-spin Peripheral Blood Mononuclear Cells (PBMCs) are Pre-spin Post-spin (photograph). blood cells with round nuclei, such as monocytes and lymphocytes, with the lymphocyte population consisting of T cells, B cells, and natural killer (NK) cells. PBMCs are Platelet + Platelet +. Plasma Plasma a critical component of the immune system, playing an Diluted Blood integral role in the body's defense mechanisms. Cellular PBMC. PBMC. assays Using PBMC cultures form the backbone of Ficoll +. Gran. Ficoll Ficoll +. immune monitoring studies in clinical diagnostics and Gran. RBC. therapeutic design. Given that ineffective separation RBC. of lymphocytes from whole blood can significantly alter cellular responses and lead to unreliable results, it is essential to start every assay with a rapid, simple, Figure 1. and reliable method of PBMC Isolation and subsequent Sample layering before and after Ficoll density gradient quantitation.
2 Centrifugation. Separation of PBMCs from whole blood is most principle in a handheld format. The instrument uses a commonly achieved through density gradient combination of analog and digital hardware for sensing, centrifugation Using Ficoll 1-3. Differential migration signal processing, data storage, and graphical display. The during centrifugation results in the separation of cell precision-made, consumable polymer sensor has a laser- types into different layers (Figure 1). The bottom layer drilled aperture in its cell sensing zone that enables the contains Ficoll-aggregated red blood cells. Immediately instrument to use the Coulter principle to discriminate above this is a diffuse layer containing mostly cell diameter and volume at sub-micron and sub-picoliter granulocytes and unbound Ficoll . Due to a slightly lower resolution, respectively. Previous work has shown that, density, the lymphocytes (including the monocytic PBMC by Using the new 40 m aperture sensor, the Scepter.)
3 Fraction) sediment at the interface between the Ficoll cell counter was able to accurately and precisely count and uppermost plasma/platelet layer. PBMCs are removed a much broader range of cell types, including small from the interface and subjected to multiple washes in cells (< 6 m in diameter) such as PBMC and red blood PBS (or cell medium) to remove any residual Ficoll. Cell cells (RBC)4. This short report outlines a protocol for the isolates are then ready for analysis or culture setup. Isolation of PBMC from whole blood and subsequent sample analysis Using the Scepter cell counter. The Scepter cell counter combines the ease of automated instrumentation and the accuracy of impedance-based particle detection Using the Coulter EMD Millipore is a division of Merck KGaA, Darmstadt, Germany Materials and Methods 11. Decant the supernatant and resuspend the cell pellet This protocol is used to fractionate 10 mL of defibrinated in appropriate volume of PBS (or media).
4 Or anti-coagulant treated peripheral blood* (or buffy coat) N. otes: Using 15 mL Ficoll in a 50 mL conical tube. A 15 mL tube 1. F rom healthy blood, PBMC yield ranges between x 106 cells per mL blood. For 10 mL blood, resuspend can be used for fractionating smaller volumes of blood;. 5 mL PBS for initial count. however, for high PBMC yield with efficient RBC removal, 2. Purification of the PBMC population may be greatly it is important to maintain the same volumetric ratio of enhanced by adding RosetteSep Human Total sample to Ficoll. Further, to ensure high viability of isolated Lymphocyte Enrichment Cocktail (StemCell Technologies cells, we recommend Using only freshly isolated blood Catalogue No. 15223) after this step. samples (< 24 hours after collection). 12. Analyze samples Using the Scepter cell counter and * Anti-coagulants include: Heparin, EDTA, citrate, acid citrate dextrose (ACD), and citrate phosphate dextrose (CPD). guava easyCyte flow cytometer 13.
5 Samples may require further dilution for accurate Ficoll density gradient separation of PBMC Counting Using the Scepter cell counter the 1. Transfer 10 mL of blood from the collection vial to a operating cell concentration range for the 40 m 50 mL tube. aperture sensor = 5 x 104 x 106. 2. Add an equal volume of PBS (1X EmbryoMax PBS, EMD Millipore Catalogue No. BSS-1006-A) and mix Scepter cell Counting sample by repeated pipetting The Scepter cell counter was used to count samples following the detailed on-screen instructions for each N. ote: Diluting blood reduces the degree of RBC aggregation as well as freeing trapped PBMC. If left undiluted, trapped step of the Counting process. Briefly, the user attaches PBMC sediment with erythrocytes, reducing yield. a 40 m sensor, depresses the plunger, submerges the sensor into the sample, then releases the plunger 3. Add 15 mL Ficoll (GE Healthcare) to a second drawing 75 L of cell suspension into the sensor.
6 The 50 mL tube. Scepter cell counter detects each cell passing through 4. Carefully layer the diluted blood over the Ficoll . the sensor's aperture, calculates cell concentration, and N. ote: The diluted blood is added to the gradient by gently displays a size-based histogram as a function of cell pipeting onto the separation medium with the tube held diameter or volume on its screen. Scepter Software at an angle. To obtain good separation, it is paramount Pro was then used to upload files from the device and that clean separation of the blood and Ficoll layers is maintained prior to centrifugation perform subsequent data analysis to determine the concentrations and relative cell frequencies for the 5. Centrifuge without the brake applied at lymphocyte and monocyte fractions. 400 g x 30 min at 18-24 C. N. ote: Higher temperatures (37 C) enhance RBC aggregation guava easyCyte cell Counting reducing yield while lower temperatures (4 C) inhibit aggregation, decreasing purity.
7 We recommend centrifuging 10 L of each PBMC sample was diluted in 190 L PBS. at 18-24 C. Samples were then analyzed on a guava easyCyte HT. system to determine the concentrations and relative cell 6. Carefully remove the tubes from the centrifuge so as frequencies for the lymphocyte and monocyte fractions. not disturb the layering. 7. Draw off the upper plasma layer being careful not to Cell surface staining and subset determination disturb the lower PBMC interface. For each sample, 100,000 PBMCs were resuspended in 8. Remove the PBMC layer and transfer to a new 50 mL 100 L PBS+ BSA. To distinguish the discrete cell tube. The volume recovered should be approximately subsets present in PBMC, samples were stained with 10-12 mL. the following combination of fluorescently labeled N. ote: Attempt to remove the entire interface while antibodies: anti-CD3-PE (T-cells), anti-CD19-Alexa minimizing the amount of Ficoll or remaining plasma Fluor 488 (B-cells), anti-CD16/CD56-APC (NK cells), and layer.
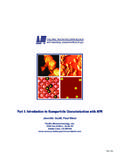
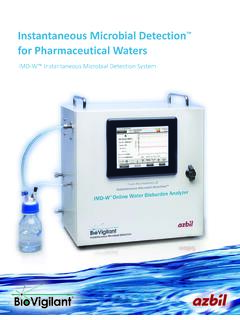
8 Excess Ficoll or plasma recovery will result in anti-CD14- PECy7 (Monocytes) (eBioscience). Samples contamination by granulocytes or platelets and plasma were incubated at room temperature for 20 minutes, proteins, respectively. washed with PBS, then resuspended in 200 L PBS prior 9. Wash PBMC fraction Using ~3 volumes of PBS. to acquisition. Samples were analyzed (3000 cells/sample Centrifuge at 100 g x 10 min at 18-24 C. well) on a guava easyCyte HT system Using ExpressPro 10. Decant the supernatant. Resuspend the pellet in 5 mL software. PBS. Add PBS to 50 mL and repeat wash step. Optional: The wash step can be repeated once more 2. Results Flow Cytometer Scepter . Density gradient centrifugation Using Ficoll resulted 80 120 160 200. 30 80 120 160 200. 90. (SSC-HLin x 100). in the characteristic separation of whole blood into 4 PBMC. Side Scatter 70. PBMC. Count Count 1#.$ . Debris +. Sample 1. 50. RBC. distinct layers: an uppermost plasma layer containing Monocytes 0 10 30.
9 40. platelets, a thin PBMC band, a diffuse Ficoll layer Lymphocytes 0. 0 10 30 50 70 90. 0. 0 10 30 50 70 90 3 6 9 12 15 18. containing granulocytes, and the aggregated erythrocyte Forward Scatter (FSC-HLin x 100). Forward Scatter (FSC-HLin x 100). Diameter ( m). pellet. PBMC could be further subdivided into two 80 120 160 200. 30 80 120 160 200. 90. Debris + RBC. main populations, the lymphocytes and monocytes. (SSC-HLin x 100). PBMC Debris Side Scatter 70. Count Count The lymphocyte subset could be further subdivided Sample 2 Lymphocytes 50. RBC Lymphocytes 0 10 30. Monocytes Monocytes into T cells (CD3+), B cells (CD19+), and NK cells 40. 0. 0 10 30 50 70 90. 0. (CD16/56+). Monocytes could be distinguished from total 0 10 30 50 70. Forward Scatter 90. Forward Scatter 3 6 9 12. Diameter ( m). 15 18. (FSC-HLin x 100) (FSC-HLin x 100). lymphocytes on the basis of CD14 expression. Samples 30 80 120 160 200. 140. were diluted and fractions analyzed Using the flow 90.
10 (SSC-HLin x 100). PBMC. Side Scatter 70. 100. Count Count cytometer and Scepter cell counter to determine total 50. Sample 3. 60. PBMC concentration. In addition, aliquots of each sample 0 10 30. 0 20. 0. were stained with fluorescent antibodies to the surface 0 10 30 50 70 90. 0 10 30 50 70. Forward Scatter 90. 3 6 9 12. Diameter ( m). 15 18 . Forward Scatter markers outlined above. (FSC-HLin x 100) (FSC-HLin x 100). From the color dot plots in Figure 2, we discerned three Figure 2. event populations found within each sample: debris and Representative data comparing PBMC samples acquired on the flow cytometer and Scepter . red blood cells (Black), a lymphocyte subset (composed cell counter. Dot plots show debris and red blood cells (Black), a lymphocyte subset (composed of of varying numbers of T cells (Red), B cells (Aqua), NK varying numbers of T cells (Red), B cells (Aqua), NK cells (Green)), and a monocyte subset (Blue). cells (Green)), and a monocyte subset (Blue).