Transcription of APTA Physical Therapy Workforce Analysis
1 apta Physical Therapy Workforce AnalysisA Report From the American Physical Therapy AssociationDecember 2020 2020 American Physical Therapy Association. All rights goal of Workforce planning is to optimize access to Physical Therapy . By analyzing and forecasting Workforce supply and demand, it s possible to identify shortage areas, evaluate employment potential, and bolster advocacy that improves health care delivery. This report uses data from multiple sources to evaluate the Physical Therapy Workforce as of 2019. (It is important to emphasize that while this report was released in 2020, the data was collected prior to the COVID-19 health crisis, which affected employment across health care. For more on the effects of COVID-19, see apta s report Impact of COVID-19 on the Physical Therapy Profession. )Data sources include apta s membership database and practice profile survey, the Commission on Accreditation in Physical Therapy Education, the federation of State Boards of Physical Therapy , the Bureau of Labor Statistics, the United states Census Bureau, and Analysis by Deloitte of the Census Bureau s American Community will note differences in the data from these sources.
2 Wherever possible, we have noted differences in how these sources report their of ContentsIntroduction ..2 Geographic Distribution ..4 Number of Licensed Physical Therapists Per 100,000 People by State ..4 Number of Licensed PTAs Per 100,000 People by State ..4 Number of Employed Physical Therapists by State ..5 Number of Employed Physical Therapist Assistants by State ..5 apta Physical Therapist Membership by State ..6 apta Physical Therapist Assistant Membership by State ..6 Median Age ..7 Sex and Gender ..7 Median Salary ..7 Median Salary by Sex and Gender ..7 Race and Ethnicity ..8 Race and Ethnicity of Physical Therapists ..8 Race and Ethnicity of Physical Therapist Assistants ..8 Race and Ethnicity of the Population ..8 Projecting the Supply and Demand of PTs Through 2030 ..9 Physical Therapist Supply and Demand ..9 Methodology ..10 PTA Projections ..10 apta Workforce Planning History.
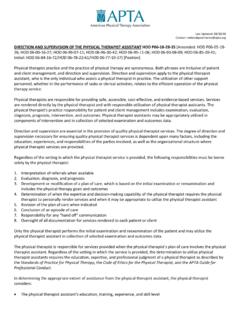
3 10 2020 American Physical Therapy Association. All rights DistributionAs of 2019, there were 312,716 licensed Physical therapists and 127,750 licensed Physical therapist assistants in the United states , according to data from the federation of State Boards of Physical Therapy . Based on the population, there are 95 Physical therapists per 100,000 people and 39 Physical therapist assistants per 100,000 people. The maps below show a breakdown of these numbers in each state. Number of Licensed Physical Therapists per 100,000 People by State60845866621175556615452909365527494 5589521091123880987457788211076113596277 73718968445634761136654654842 Number of Licensed PTs per 100,000 People by State6743 Washington, of Licensed Physical Therapist Assistants per 100,000 People by State30315327342223324815405317204567173 1272819361849273940314441273329435641454 2371744240232417452052 Number of Licensed PTAs per 100,000 People by State146 Washington, 2020 American Physical Therapy Association.
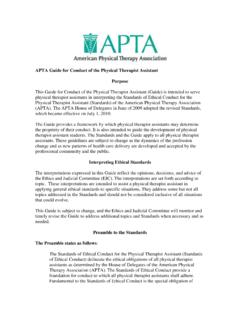
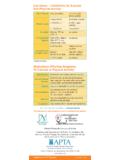
4 All rights Employment by St at e4805,5 901,2 606,1 606,7 207601,8 9015,4 004,9 209203,1 701,1 0011,8 002,8 902,3 008,2 206406,3 1017,7 101,3 807,8 601,2 501,5 701,6 601,1 504,4 901,6 304,6 708,0 607,5 404,5401,2 702,9 602,6 502,3 402,0 805,0 5010,1 701,3 905,4 3013,7 506101,0 703,9 305,1 0021,7 301,9 903,6 002,7 70640790 Washington, ,7 30 The maps below show the distribution of PT and PTA employment as of 2019, according to data from the Bureau of Labor of Employed Physical Therapists by StateNumber of Employed Physical Therapist Assistants by StatePTA Employment by St at e1701,6 007601,5 802,9 301508007,5 503,2 902801,5 803905,3 308101,5 506,0 401302,8 205,4 106001,4 203304706502802,4 808101,5 903,5 402,5 201,8 803501,4 901,5 701,2 401,0 302,6 203,9 805902,5 706,7 801903406301,5 005,7 501,3 702,9 001,7 90190 Washington, ,5 50130 2020 American Physical Therapy Association. All rights maps below show the distribution of PT and PTA membership in apta as of 2019, according to the association s member Physical Therapist Membership by State2432,4 235232,7 022,8 593881,0 285,8 441,7 274221,1 114134,7 761,3 307423,2 007142,6 386,2 075102,6 884986911,0 765571,7 776262,2 052,7 022,4 551,5 515451,0 611,3 099531,3 031,5 643,2 265672,3 115,2 784244611,1612,1 118,3 646661,7 07869 apta Physical Therapist Membership by Stateas of 12/31/2019397316 Washington, ,3 64 apta Physical Therapist Assistant Membership by State 3124388273415151951,1 9434661258404511502145241927448714010223 5626159302177194483191193252002112311702 38401902121,2 5572815425594296137202 apta Physical Therapist Assistant Membership by Stateas of 12/31/20196026 Washington, ,2 55 2020 American Physical Therapy Association.
5 All rights AgePTsPTAsData Source4034 apta (2019)4241 BLS (2019)*4137 Data USA (2018)**BLS and Data USA combine PTAs and Physical Therapy aides when reporting and Gender Sex refers to a person s biological characteristics. Gender refers to a person s social identity. For purposes of this report, it is unclear whether PTs and PTAs were self-reporting their sex or gender, or if options other than male/man or female/woman were available to SourceWomenMenWomenMen65%35%71%29% apta (2019)68%32%63%37%BLS (2019)70%30%68%33%Data USA (2018)*BLS and Data USA combine PTAs and Physical Therapy aides when reporting Annual SalaryPTsPTAsData Source$85,000$52,000 apta (2016)$89,440$58,790 BLS (2019)*$78,350$48, Census Bureau (2018)**BLS and Census combine PTAs and Physical Therapy aides when reporting salary Annual Salary by Sex and Gender According to a Pew Research Center Analysis , in 2018, in the across all professions, women earned 85% of what men earned.
6 Based on apta data, female PTs earned 90% of what male PTs earned, and female PTAs earned 91% of what male PTAs earned. Similarly, based on Data USA data, female PTs earned 80% of what their male counterparts earned, and female PTAs earned 89%. This information shows that regardless of the economic data, gender wage gaps are notably present, and the Physical Therapy profession is not immune to this systemic SourceWomenMenWomenMen$81,118$90,000$50, 000$55,000 apta (2016)$67,550$84,281$34,493$38,870 Data USA (2018)**Data USA combines PTAs and Physical Therapy aides when reporting salary data. 2020 American Physical Therapy Association. All rights and EthnicityBlack and Hispanic/Latino PTs and PTAs are underrepresented in the Physical Therapy profession, compared with the general population based on Census data. apta is seeking to address this gap through numerous activities, including expanded student recruitment efforts to diversify the pipelines into the profession, formal recommendations to the Commission on Accreditation in Physical Therapy Education regarding accreditation standards and required elements that would improve diversity in PT and PTA education programs, the development of a standing committee on diversity, equity, and inclusion, and various DEI fundraising efforts, including the two-year Campaign for Future to learn and Ethnicity of Physical TherapistsPTsAPTA (2019) Data USA (2018)White (not Hispanic) (not Hispanic) (not Hispanic) Indian (not Hispanic) and Ethnicity of Physical Therapist AssistantsPTAsAPTA (2019)Data USA (2018)*White (not Hispanic) (not Hispanic) (not Hispanic) Indian (not Hispanic)
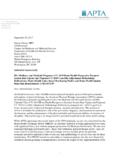
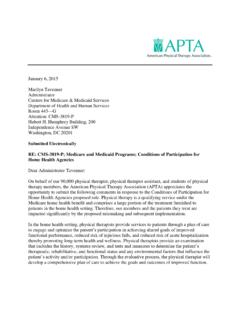
7 *Data USA combines PTAs and aides when reporting race and and Ethnicity of the Population per Census Categories (2018)White alone Relates to White (not Hispanic) in previous or African American alone Relates to Black (not Hispanic) in previous alone Relates to Asian (not Hispanic) in previous Indian and Alaska Native alone Relates to American Indian (not Hispanic) in previous or Latino Relates to Hispanic/Latino in previous Hawaiian and Other Pacific Islander alone Relates to Other in previous other race alone Relates to Other in previous or more races Relates to Other in previous 2020 American Physical Therapy Association. All rights the Supply and Demand of PTs Through 2030 Using the data and methodology described below, apta s model shows that projected increases in the national supply of Physical therapists is outpacing expected growth in demand for services based on an increase in the population who have health on current graduation, licensing, and attrition trends, the model predicts an estimated surplus of 25,235 Physical therapists by 2030.
8 This projected imbalance provides opportunities for the profession to correct existing imbalances in the geographic distribution of Physical therapists, meet increases in demand due to changing population characteristics, and continue expanding in emerging areas of Therapist Supply and Demand (All numbers in thousands)2018 2019 2020 2021 2022 2023 2024 2025 2026 2027 2028 2029 2030 2031 Year190K195K200K205K210K215K220K225K230K 235K240K245K250K255 KPhysi ca l Th era pist FTE s (i n th ousa nds)220K221K218K223K212K228K217K224K214K 227K225K215K233K230K237K253K226K212K241K 222K249K215K245K219 KLice nse d PTsDema nd 2020 American Physical Therapy Association. All rights s model uses the Workforce -to-population ratio method of modeling. The intent of apta s model is to determine if the supply of Physical therapists is keeping pace with increased demand from population growth over a 10-year period. Thus, the model does not account for potential changes to service delivery or patient demographics that could happen within this time frame.
9 Furthermore, as the base year of the model is 2019, the model uses data collected prior to the COVID-19 pandemic and does not make assumptions about the impact of COVID-19 on Physical therapist supply and demand. This impact will be reflected in future projections as the data becomes available. To calculate supply, apta uses data on the number of new entrants to the Workforce minus attrition from the profession. New entrants include recent graduates from Physical therapist professional programs who pass the licensure exam and internationally educated Physical therapists who obtain licensure in the United states . Attrition includes individuals transferring to other occupations or exiting the labor force altogether. The percentage of Physical therapists who practice part time also is factored into the model, thus supply is represented as full-time equivalents, or FTEs. To calculate demand, apta uses the current ratio of FTE Physical therapists to the population with health insurance, as reported by the ProjectionsUnfortunately, there is not enough data available on the attrition of Physical therapist assistants to make reliable projections on the future supply of PTAs.
10 Should this data become available, apta can use its model to project both the supply of and demand for PTAs. apta Workforce Planning HistoryAPTA s history of Workforce Analysis dates back to the 1990s, when the association produced research briefings on Workforce demographics, recruitment and retention, the impact of policy and payment on Workforce , and other trends. In 2010, apta commissioned a Workforce Task Force to develop a model to more accurately project Physical therapist supply and demand through 2020. The resulting apta Workforce Model included three scenarios based on differing levels of attrition, which projected either a shortage or surplus of Physical therapists. The model used data from apta member surveys, the federation of State Boards of Physical Therapy , and other publicly available sources. In 2012, apta began collaboration with FSBPT and the Health Resources and Services Administration on a minimum data set, A consistent set of data elements to be collected on all licensees at regular intervals in order to understand Workforce needs related to access to health care (FSBPT, Winter 2015, federation Forum, The Minimum Dataset ).