Transcription of AreSomeThings Unrepresentable? - Rita Raley
1 AreSomeThingsUnrepresentable?Alexander GallowayAbstractJacques Rancie`re, in his essay Are Some Things unrepresentable ? , puts fortha challenge that is ever more pertinent to our times. What constitutes theunrepresentable today? Rancie`re frames his answer in a very specific way: thequestion of unrepresentability leads directly to the way in which politicalviolence may or may not be put into an image. Offering an alternative toRancie`re s approach, the present article turns instead to the informationsociety, asking if and how something might be unrepresentable in a worldsaturated by data and information. Thus one approaches the issue of trans-parency and secrecy here from the perspective of the relative perspicuity (oropacity) of data visualization. Two theses structure the argument, first that data have no necessary visual form and, second, that only one visualizationhas ever been made of an information network.
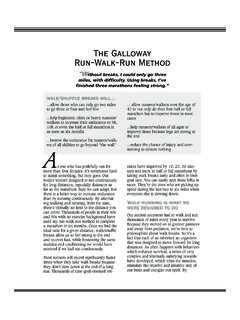
2 The tension between thesetwo theses leads to a disconcerting conclusion, that the triumph of informa-tion aesthetics precipitates a decline in informatic perspicuity. One is obli-gated therefore to call for a strong reinvigoration of poetics andhermeneutics within the digital universe, so that representation as such cantake place, perhaps for the first wordsaestheticsjallegoryjdigitaljinforma tionjviolencejvisual cultureINSPRING2010theNew York Timespublished a PowerPoint slide ontheir front page taken from a meeting between General StanleyMcChrystal and other members of military and government. The slidedepicts theAmerican military strategy in Afghanistan in the form of a massivediagram of forces and relations. A marvel of data visualization, the slide isexhaustively detailed. One hundred and twenty nodes, rendered with phrasessuch as Tribal Governance and Insurgents , are connected together withscores of lines and arrows.
3 Like a flow chart, these lines demonstrate links ofinfluence. Font size indicates the relative importance of each text , Culture & Society2011 (SAGE, Los Angeles, London, New Delhi, and Singapore),Vol. 28(7-8): 85^102 at UNIV CALIFORNIA SANTA BARBARA on December 12, from Color clusters designate broad zones based on themes such as the government,the coalition forces, the population, and the insurgency. Yet the frenzy ofwords and links begins to overwhelm the eye. It is unclear exactly what theslide is meant to convey or indeed if it is meant to convey anything at all. When we understand that slide, we ll have won the war , GeneralMcChrystal dryly the room erupted in laughter (Bumiller,2010: 1). Despite an overwhelming amount of detail, the PowerPoint slide isnot easy to digest. In fact, the high level of detail seems to hinder comprehen-sion rather than aid it.
4 Unlike realism in painting or photography, wherein anincrease in technical detail tends to bring a heightened sense of reality (atleast in the traditional definition of aesthetic realism that has held sway moreor less since the Renaissance), the high level of technical detail visible hereoverwhelms the human sensorium, attenuating our sense of reality. Rather,like a fractal whose complexity does not decrease when viewed through a mag-nifying glass, the information contained in McChrystal s PowerPoint doesnot grow more coherent the longer one inspects it. Eschewing lucidity, the dia-gram withdraws from the viewer s grasp, effectively neutering its capacity as avehicle for information. One is left wondering what exactly McChrystal sPowerPoint slide is meant to communicate. Is it communicating America smilitary strategy in Afghanistan? Or the reverse: is it communicating how dif-ficult such strategies are to communicate in the first place?
5 Indulgefora moment would happen ifonewere totalk about McChrystal s PowerPoint slide in strictly aesthetic terms, as if onewere talking about a painting? Would it be possible to view this peculiarbrand of visual representation as a work of aesthetics? What would be theresult? A painting of military life? An image of a network? Or even, to use aFigure 1 PowerPoint slide depicting the American military strategyin AfghanistanSource: Bumiller (2010)86 Theory, Culture & Society 28(7-8) at UNIV CALIFORNIA SANTA BARBARA on December 12, from term borrowed from Gilles Deleuze, a visualization of the society of controlitself (1995)?1In fact, even at a purely aesthetic level it is not clear what pre-cisely McChrystal s PowerPoint is trying to represent. Is it trying to representdata, an algorithm, a diagram, a system, a network? These terms all seem toconnect to each other, yet they mean very different things.
6 Data would be rep-resented very differently from an algorithm, would it not? Yet it would besafe to say that all these terms fall, more or less, under the umbrella of in that light, can this PowerPoint slide reveal anything interest-ing about the nature of information aesthetics? Can it tell us anything aboutthe relationship between transparency and concealment? Between represent-ability and unrepresentability?One might begin by talking about the obvious sensory qualities of theimage, its use of color, line and variations in text size inject a senseof scale into the thicket of curves and text labels, demarcating net-work nodes, achieve an appealing texture. No nodes overlap. Occupying itsown area of the image, each node is surrounded by a moat of white evenly into discrete cells within the frame, they demonstrate what arthistorian Alo| s Riegl (1985) called tactile perception.
7 The lines too are wellspaced. More like links than mere strokes of a pen, these marks introducemovement into the image. Like a complex vector field, the lines map multiplerelationships and hierarchies. Showing what comes first, second, or thirdwithin any segment of flow, the lines establish specific connections betweenparts of the image, while discounting other ones. As if to mitigate the tenden-cies of the links and the nodes, the seven color clusters ^ navy blue, light blue,red, black, light green, dark green, and orange ^ reorganize the entire imageinto clearly marked themselves echo the Green Zones erected incities like Baghdad and other global sites under American military as links flow in and out, the color clusters remain coherent, like city-states organized under federation to an imperial such a reading of the image can only go so far.
8 Amid all the talkrecently of data and information it becomes more and more difficult toknow what these terms mean, or indeed to tell them apart in the first the nodes meant to represent data, while the links represent information?Is data meant to be textual and static, while information is elastically struc-tured via flows and arrangements?Etymology provides some basic Latindata, a participle inthe neuter, means literally the things having been given . Or in short form onemight render the term more elegantly as the givens . French preserves thisdouble meaning nicely by calling data thedonne natural gift, as empiri-cal trace, data are not simply measurements or recorded facts, they are also insome sense ontologically raw, not so much thrown into the world, but leftover, bare, remaining after the tide of being recedes. So with data there isstress on the empirical proffering of measurable or otherwise observable factthat has been given forth.
9 Something has already taken place and, via a gift orendowment, it enters into presence. (Concerning this last point, one mightGalloway ^Are Some Things unrepresentable ? 87 at UNIV CALIFORNIA SANTA BARBARA on December 12, from elaborate the argument, given more time, that data have always had a certainphenomenologicalclaim.)Informatio n, ontheotherhand, stemsfromthe Latin for the actoftakingform or being put into form. So, in contrast to data, information stresses lessa sense of presence and giving-forth, and more a plastic adoption of exists whenever worldly things are in-formed , or put into form .As Vile m Flusser put it once in an illustrative vignette, the leaves that fall inthe autumn have no information because they are scattered to and fro, but ifone puts them into form ^ for example by moving them around to spell out aword, or simply by raking them into piles ^ the leavesgain information(Druckrey, 1999).
10 The worldly things, having been previously given, have nowbeen given if data open a door into the realm of the empirical andultimately the ontological (the level of being), information by contrast opens adoor into the realm of the this in mind, and since information differs from data in a moreimmediate and dramatic way, we begin with the first of two theses:Data haveno necessary visual how could this be true? Are we not drowning today in data visualiza-tions? Is our world today not the very embodiment of data made visible?Consider the genre of image-making known as information exemplars exist, from John von Neumann s influential flow chartsfrom the 1940s, to the crude diagram given in the appendix to Karl Deutsch sNerves of Government(1966), to the network diagrams in Freud s work (andcertainly the work of Jacques Lacan and Fe lix Guattari is full of them), toEdward Tufte s books, or today s ubiquitous maps of the internet , which allseem to resemble a large cauliflower floating free somewhere beyond the be sure, the first thesis is a very particular one, so let me reiterate it inmore verbose language.