Transcription of Atmospheric Dispersion Modeling
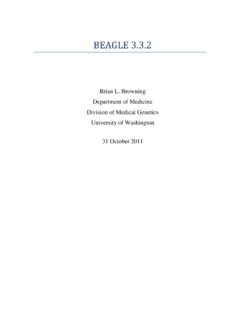
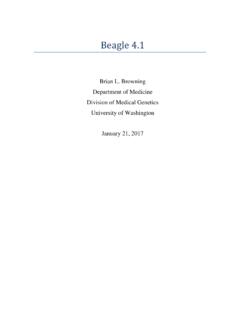
1 Atmospheric Dispersion ModelingProfessor Tim LarsonCEE 357 Types of Models Source Receptor Dispersion Calculations Wind Tunnel Empirical Scaling Linear Rollback Non-linear (chemistry/deposition) Receptor Source Deduce source fingerprints (statistical) Microscopy (particle shape & composition) Receptor Receptor Forecasting and interpolation Spatial and temporalDilution vs Dispersion :The Importance of Averaging TimeThe instantaneous puffs are dispersed by fluctuating wind directions. Instantaneous Conc. ProfileTime Averaged Profile Puffs of PollutionWindThe instantaneous concentrations are not described by steady-state plume models. The time averaged values are. Dispersion models describe time-average plumesSource.
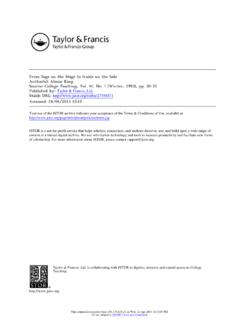
2 Slade et al Meteorology and Atomic Energy, 1968 instantaneoustime-averagedInstantaneousP lume ShapeTime-averaged Plume ShapeHeating of the surfaceUnstable Daytime ConditionsSunny, clear skiescolder, denserairwarmer, lighterairVisible radiation to groundLarge scale vertical motionsCooling of the surfaceStable Nighttime ConditionsClear skiescolder, denserairwarmer, lighterairInfrared radiation to spaceVertical motions suppressed by density gradientNeutral Conditions (day or night)relatively high wind speedsMotions not affected by buoyancy forcesVertical air motions due to shear stressesMinimal heating or cooling of the surfacePasquill-Gifford-Turner Stability Classifications(view from side)Strongly Unstable(view from side)StableSurface Level Impacts Varywith Meteorology and Release Heighthigh/moderatesurfacemoderate/lowel evatedneutralvery highsurfacenot significantelevatedstablehigh/moderatesu rfacehighelevatedunstableSurface ImpactsRelease HeightStabilityFig 4-3, in Martin et alwindDescribing Plume ConcentrationsFactors Affecting Atmospheric Dilution (Mixing) Wind SpeedConcentration is inversely proportional to wind speed Tim s Simple Plume Modelhx123mass/timepassingpoint 1=mass/timepassing thrudisk area 2mass/timepassing thrudisk area 3C1 > C2> C3=Simplified Steady-State Plume Model*Pollutant is well mixed and confined within the cone*Pollutant is continuously swept thru the cone by the windConcentration vs.
3 Distance downwind depends upon cone shape 2disk of areaspeed windrateemission Mass 2at air of Conc. 12 Simple Model #1: 23mm/sec g/secm g Disk shape depends upon stability categoryMore unstable and thus more pronounced vertical spreadingunstableneutralstableHeating of the surfaceSunny, clear skiescolder, denserairwarmer, lighterairVisible radiation to groundLarge scale vertical motionsCooling of the surfaceClear skiescolder, denserairwarmer, lighterairInfrared radiation to spaceVertical motions suppressed by density gradientAATime-averaged concentration across AAGaussian (normal) distribution occurs across AA due to changes in wind direction over averaging periodShape is described by plume sigmas Most probable wind directionsourcewindMass is not uniformly distributed within the cone s volume More Detailed Plume Model functionon distributiGaussian 2disk of areaspeed windrateemission Mass 2at Conc 12 Simple Model #2.
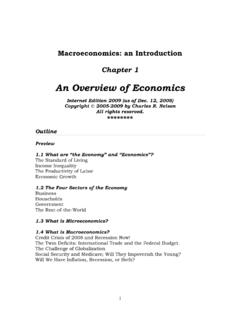
4 XzyXis the time-averaged wind direction,Yis the cross-wind direction,Zis the vertical dimension 23mm/sec g/secm gGaussian Plume(Concentrations vary with x, y and z) yand zare functions of xPlumeCenterlinexh = hs+ hPhysical stack height,hsPlume rise, h Effective stack height, hPlume Reflection off of the Ground(pollutant cannot penetrate the ground)Actual Source Virtual Source(below the surface)Most of plume above the surfacePlume begins to reflect off the surfaceReflected material (shaded area)Resulting in an asymmetric vertical profileReflection is modeled by adding a virtual source contribution to the real onehGaussian Point Source Plume Model:Wind speed evaluated at effective stack heightMass emission rate}Corresponds to disk area in simple model (values depend upon stability class & downwind distance, x)Distribution of mass in vertical dimension (z) at a given downwind distance, x (includes the effect of surface reflection)Distribution of mass in cross-wind dimension (y) at a given downwind distance, xPollutant concentration as a function of downwind position (x,y,z) 2y22222zy2 yexp2exp2expu 2Q z)y,C(x,zzhzhz Effective stack height, including rise of the hot plume near the sourceGaussian Plume(Concentrations vary with x, y and z)For a given x, the max conc.
5 Is at the plume centerline and decreases exponentially away from the centerline at a rate dependent upon the sigma values, yand z. yand zare functions of xPlumeCenterlineCross-wind distance from plume centerline (m)Vertical distance from plume centerline (m)Concentration distribution in a Gaussian plume ( y= 20 m; z= 10m; centerline concentration = )Source: Hanna et al, 1981 Note: theoretical plume has infinite extent in all directions! y zCalculation Procedure1. Determine stability class from meteorology2. Compute wind speed at effective stack height, h3. Compute yand zat a given downwind distance, x4. Choose appropriate receptor height, z5. Compute C(x,y,z) using Gaussian plume equationPasquill-Gifford-Turner Stability ClassificationsCalculation Procedure1.
6 Determine stability class from meteorology2. Compute wind speed at effective stack height, h3. Compute yand zat a given downwind distance, x4. Choose appropriate receptor height, z5. Compute C(x,y,z) using Gaussian plume equationCalculating Wind Speed as a Function of Height"Power Law" MethodThis approach is used with the EPA models and employs a simple "power law" function. The wind speed at any elevation is estimated as a function of the height of the actual wind speed measurement, the stability category, and the "wind profile exponent", as follows:Uz=UzrefzzrefpWhereuz= wind speed at some arbitrary elevation z [meters] uzref= wind speed at the "reference" (actual measurement) height [m/sec]zref= the elevation of the actual wind speed measurement [m] p= wind profile exponent, a function of stability of p as a function of stability category are summarized in the following table.
7 These are the default p values recommended by EPA for use when zref= 10 "urban" and "rural" classifications attempt to capture the effect of surface roughness. The largest effect is seen under very stable conditions ( F ).Example Calculation: For the rural case, if the wind speed is 3 m/sec measured at an elevation of 10 meters and the stability category is "D", then p = and the wind speed at z=100 m is:U100 = 3. 5 m/s100 = 4. 94 m/sThere are other ways to estimate the wind speeds as a function of height, but the power law approach is probably the simplest and most straightforward Procedure1. Determine stability class from meteorology2. Compute wind speed at effective stack height, h3. Compute yand zat a given downwind distance, x4.
8 Choose appropriate receptor height, z5. Compute C(x,y,z) using Gaussian plume equationSigma-yxSigma-z xis in kilometers yis in meters is inradiansCross-wind distribution:bzax Vertical distribution:xis in kilometers zis in metersa, b depend onxPlume sigma formulas from EPA s ISC ModelPasquill Stability Category x (km) a b A* <.10 - - - - - - - > ** ** * If the calculated value of zexceed 5000 m, zis set to 5000 m. bzax B* <.20 - > * All <.
9 30 - - - - > * If the calculated value of z exceed 5000 m, z is set to 5000 m. ** z is equal to 5000 m. Pasquill Stability Category x (km) a b bzax Pasquill Stability Category x (km) a b E <.10 - - - - - - - > <.20 - - - - - - - - > bzax Pasquill Stability Calculation Procedure1. Determine stability class from meteorology2. Compute wind speed at effective stack height, h3.
10 Compute yand zat a given downwind distance, x4. Choose appropriate receptor height, z5. Compute C(x,y,z) using Gaussian plume equationSteady State Gaussian Point Source Plume Model:Wind speed evaluated at effective release heightMass emission rate}Corresponds to disk area in simple model (values depend upon downwind distance, x)Distribution of mass in vertical dimension (z) at a given downwind distance, x (includes the effect of surface reflection)Distribution of mass in cross-wind dimension (y) at a given downwind distance, xPollutant concentration as a function of downwind position (x,y,z) 2y22222zy2 yexp2exp2expu 2Q z)y,C(x,zzhzhz Effective stack height, including rise of the hot plume near the sourceExample Calculation 2y22222zy2 y-exp2exp2expu 2Q z)y,C(x,zzhzhz Given:Q = 10 grams/sec.