Transcription of Barley growth guide - .NET Framework
1 Barley growth guide Contents 3 Introduction 4 Capturing natural resources 5 Understanding Barley yields 7 What are benchmarks? 8 Crop life cycle 10 Establishment 12 Leaf emergence and tillering 14 Root growth and distribution 15 Nitrogen (N) uptake17 Canopy expansion and senescence 19 Biomass growth 21 Stem elongation 22 Stem carbohydrate storage 23 Ear formation 25 Grain filling and ripening 26 Yield 28 Grain quality 30 Glossary 31 Acknowledgements 32 Cereal growth stages and benchmarksAt-a-glance information on key terms (glossary), benchmarks and growth stages can be found at the back of this images courtesy and copyright of AHDB, except for the cover photograph, copyright of Gary Naylor are vital for good management and learning. As well as assessing weeds, pests and diseases, crop managers must assess the crop itself. Crop progress, structure and final performance can then be compared with benchmarks or new crop s growth best relates to the natural resources that it captures.
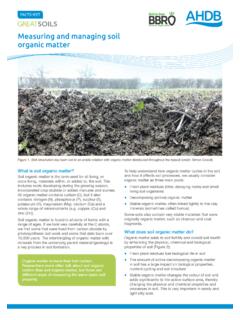
2 By knowing available resources, managers can tell whether better or worse than expected growth was due to weather or husbandry. Crop assessments should be objective and, where possible, measured. This guide presents metrics by which production targets can be set and crop progress monitored. It also explains how the metrics interrelate and can be growth guide presents a series of benchmarks for Barley . Benchmarks are a quantitative reference point against which a crop s progress, structure and final performance can be guide can be used to understand the factors that affect crop growth , including the relative importance of variety, natural environment and husbandry. This guide aims to support understanding and enhancement of Barley production through improved steps in any cycle of management are to:IntroductionAdjust inputsSet targetsMonitor successAssess progress3 Capturing natural resources4 Figure 1. Shows the capture of and utilisation of natural resources, particularly solar energy, water and carbon dioxide in Barley .
3 It illustrates how these resources convert into grain and non-grain energy (expressed here in t/ha biomass or grain). It also introduces the concept of thermal time , which represents the time taken for the crop to move from one growth stage to the next, based on the cumulative heat receivedSolar energy 41% Energy capture Biomass Straw and chaff biomass Grain dry growth Crop development 2 15 Above ground biomass (t/ha) 10 50 Rooting depth (m) 1 = Grain yield @15% moisture Thermal time ( C days) Soil texture and depth dictate soil waterholding capacity (eg 150mm/m for amedium soil type, not over rock) April July rainfall eg 200mm 1,000 2,000 2,900 Solar energy: 35TJ/ha/year 100mm Soilwater captureplus summer rain= 300mm totalwater capture Yield determinationCrops harvest energy they convert natural resources (solar energy, carbon dioxide and water) into edible and other forms of energy. Water is required in proportion to the energy yields depend on the following: Available natural resources Their capture Their conversion to harvestable grainIn the UK, light limitation of Barley yields is more common than water limitation.
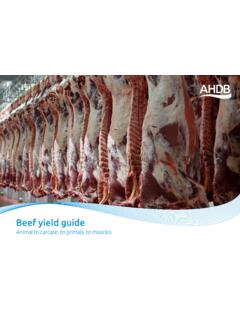
4 Water limitation becomes more common as yields natural resources cannot generally be controlled, so yields must be managed primarily through influencing their capture depends mainly on green canopy longevity. Each five extra days of full light capture by a green canopy should be associated with 1t/ha of extra crop growth . Average long-term (1981 2010) annual solar radiation map for the UK is shown in Figure long-term (April July, 1981 2010) rainfall map for the UK is shown in Figure capture depends mainly on rooting depth. On a soil holding 15 per cent available water, an increase in rooting depth of 14cm should provide an extra 20mm of water, which should support one extra t/ha of biomass Barley yieldsIf light is limiting Yield (t/ha) = Light energy (TJ/ha) x Capture (%) x Conversion (t/TJ) x Harvest IndexIf water is limiting Yield (t/ha) = Available water* (mm) x Capture (%) x Conversion (t/ha/100mm) x Harvest Index* The sum of summer rainfall and soil-held 3.
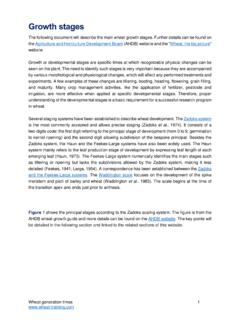
5 Average rainfall April July, 1981 2010 (mm)Newcastle<3030 3232 3434 3636 3838 40>40 CambridgeSwindonBirminghamYorkGlasgowBel fastAberdeenPlymouthFigure 2. Average annual solar radiation 1981 2010 (TJ/ha)NewcastleCambridgeSwindonBirmingh amYorkGlasgowBelfastAberdeenPlymouth<100100 200200 300300 400400 500500 600600 700>7005 Sink limitationThe number of grains set and the potential size of each grain determine a crop s sink capacity for new assimilates. Unlike wheat, Barley commonly has insufficient grains to store all assimilate formed during grain filling, ie it is sink-limited , as shown in Figure capacity in Barley crops is largely determined by fertile shoot number. As six-row Barley varieties have more grains per ear than two-row varieties, they may be less sink-limited crops, grain yields relate more to factors affecting early growth and less to factors affecting late growth . Sink limitation can be reduced by maximising ear number. This is more important for Barley than Barley varieties are now commonly grown across the UK.
6 All hybrids are six-row varieties. When grown at recommended seed rates and recommended N supply, hybrid Barley can produce greater yields than two-row barleys, through the production of a larger number of smaller grains appear plump. Source-limited grains may appear pinched because their capacity has not been fulfilled. Plant breeding for high-specific weight may favour sink-limitation, which may also compromise resource Barley yieldsFigure 6. A comparison between source- and sink-limited cropsSource provides less than can be storedSource provides more than can be storedSource-limitedSink-limitedSourceBa rley typesBarley spikes (or ears ) can produce either one or three grains per node, giving two-row or six-row varieties (Figure 5), whereas wheat is more flexible, producing several grains per node (depending on the assimilates available during ear development).Figure 5. Two- and six-row Barley varietiesTwo-rowSix-rowThe Harvest Index is the proportion of total crop biomass growth that is harvested as grain (Figure 4).
7 The benchmark for grain is 51 per cent at harvest. Stem, leaf material and chaf make up 49 per cent of the total above ground biomass. Grain biomass arises from all growth after flowering, plus some biomass (proteins and sugars) transferred from the Index is thought to be influenced more by variety choice than by 4. Crop biomass distribution in Barley (%) growth after floweringCrop biomass (t/ha)2010051%49%Leaf, stem and chaffStem sugars6 Resource capture and conversionRates of energy absorption, carbon dioxide fixation and water transpiration by leaf canopies (Figure 7) are inherently linked, so light use, water use and biomass formation are roughly are benchmarks?This symbol identifies a benchmark a quantitative reference point against which a crop s performance can be compared. By assessing crops against benchmark values, growers can determine how best to manipulate husbandry. Some targets and husbandry responses are suggested, but this guide is not an agronomy manual.
8 'At-a-glance' benchmark values are provided at the back of this benchmark represents a median (middle) value derived from measurements made on the two-row winter Barley variety 'Pearl' during three harvest years (2002 to 2004). Trials were sown between 15 September and 10 October at six trial sites across the UK. Full crop protection and lodging control were applied to minimise potential crop losses. Fertiliser use was for feed quality grain (rather than for malting).Other varieties and sowing dates may reach key stages earlier or later than the benchmark date. Where known, differences for six-row and hybrid winter Barley and spring Barley are graphs to illustrate growth processes are based on example crops and may give data that differs from benchmarks. Some benchmark data for modern varieties can be found within the AHDB Recommended Lists datasets: Varietal influenceBenchmarks vary in the extent to which they are affected by genetics (heritability). Benchmarks with high heritability are strongly influenced by choice of variety, whereas benchmarks with low heritability are principally controlled by husbandry heritability of each benchmark is indicated as High, Medium or Low and the other management choices with a significant effect are energyH2O CO Canopy conversion 2 Figure 7.
9 Canopy capture and conversion of natural resourcesEstimated rates of conversion by Barley canopies are of dry plant biomass per terajoule (TJ) of energy intercepted and biomass per 100mm of water captured and rates are less than for wheat, probably because Barley is more production can be monitored to indicate the success of resource capture and conversion is thought to be influenced more by variety choice than by crop yield potentialsAlthough the benchmark yield for UK Barley is , potential grain yields could be as high as around 20t/ha. This higher figure is based on average resources available, management to maximise resource capture and a variety that is not sink-limited. Potentially, this can result in maximum rates of conversion to grain the growing season, a crop changes in form (development) and accumulates dry matter ( growth ).GrowthGrowth, which is the increase in crop size or weight, results from photosynthesis. It depends on: Light energy falling on the canopy Size of green canopy and, hence, light interception Capacity of the crop to utilise light energy and store dry matterGrowth is maximised by bright, cool weather because: High light energy maximises photosynthesis Cool temperatures slow development and increase the length of any phaseSummer light levels (Figure 8a) and temperatures (Figure 8b) are both lower in the North than in the cloudy days, light energy is less than half that intercepted on sunny the North, lower temperatures slow crop development and maximise growth .
10 This results in higher average yields, despite more cloudy and season effects can, therefore, be explained by variation in both light and key development phasesCrop development is measured by progress through growth stages. Crop processes switch on or off at key stages (GS21, GS31, GS39, GS59, GS71 and GS87). Detailed information on the growth stages is published near the back of this can only be altered by variety choice and sowing date. Subsequent management decisions aim to influence growth during development (eg by controlling disease or applying fertiliser).The speed at which a crop progresses through each developmental stage is governed by:Temperature: Warm conditions speed up developmentVernalisation: Cool, not freezing, temperatures advance the start of flower initiation in the majority of winter Barley varietiesDay length: Long days advance floral developmentKey management action timingsIt is important to maximise ear number to achieve yield potential in both winter and spring Barley .