Example: bachelor of science
BART: Bayesian Additive Regression Trees
1 Introduction We consider the fundamental problem of making inference about an unknown function f that predicts an output Y using a p dimensional vector of inputs x = (x1;:::;xp) when Y = f(x)+†; † » N(0;¾2): (1) To do this, we consider modelling or at least approximating f(x) = E(Y jx), the mean of Y given x, by a sum of m regression trees f(x) … h(x) · Pm j=1 gj(x)
Tags:
Information
Domain:
Source:
Link to this page:
Documents from same domain

Analysis of Variance for Regression/Multiple Regression
www-stat.wharton.upenn.eduMultiple Linear Regression Model One possible model for the population regression function is the multiple linear regression model, an analogue of the simple linear regression model: " " Interpretation of: The change in the mean of if is increased by one unit and all other explanatory variables, " are held fixed.
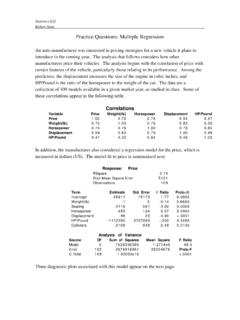
Practice Questions: Multiple ... - Statistics Department
www-stat.wharton.upenn.educertain features of the vehicle, particularly those relating to its performance. Among the predictors, the displacement measures the size of the engine in cubic inches, and ... Statistics 621 Multiple Regression Practice Questions

Logs In Regression - Statistics Department
www-stat.wharton.upenn.eduStatistics 621 Robert Stine Fall, 2001 1

Algorithmic Criminology - Statistics Department
www-stat.wharton.upenn.educhild for these approaches ... 2Usual criminology practice begins with a statistical model of some criminal justice process assumed to be have generated the data.
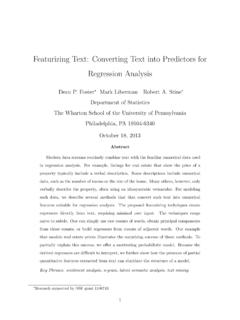
Featurizing Text: Converting Text into Predictors for ...
www-stat.wharton.upenn.eduquantitative features extracted from text can elucidate the structure of a model. Key Phrases: sentiment analysis, n-gram, latent semantic analysis, text mining Research supported by NSF grant 1106743 1

State-Space Models - Statistics Department
www-stat.wharton.upenn.eduState-space models are natural in. Statistics 910, #14 3 this class of indirectly observed processes, such as an array in which we observe only the marginal totals. State-space models The data is a linear function of an underlying Markov process (the \state") plus additive noise. The state is observed directly

The Yule Walker Equations for the AR Coefficients
www-stat.wharton.upenn.edu• multiply both sides of the model by x i, x ix i+1 = Xp j=1 (φ jx ix i−j+1)+x iξ i+1, where i and j are the time and term indices, respectively, • take expectance, hx ix i+1i = Xp j=1 (φ jhx ix i−j+1i)+hx iξ i+1i where the {φ j}s are kept outside the expectance operator because they are deterministic, rather than statistical ...

Forecasting ARMA Models
www-stat.wharton.upenn.eduForecasts revert quickly to series mean Unless model is non-stationary or has very strong autocorrelations Prediction intervals open as extrapolate Variance of prediction errors rapidly approaches series variance 8-10.00-5.00 0.00 5.00 10.00 Y 196 198 200 202 204 206 208 210 Rows observed forecast
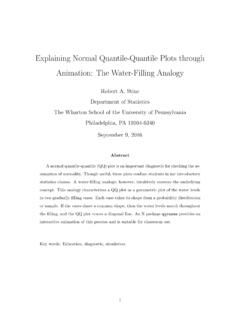
Explaining Normal Quantile ... - Statistics Department
www-stat.wharton.upenn.edudistribution that de nes the y-axis; choices include a normal distribution, the shown gamma distribution (with shape parameter 3), a beta distribution, t-distributions (with 3 and 6 degrees of freedom), and a mixture of a normal and gamma. 3 Empirical QQ plots Applying this analogy to the normal QQ plot of data requires more work and imagina-
Related documents

Lecture 1 Introduction to Multi-level Models
www.biostat.jhsph.eduRegression Model 0.56 (0.38)-0.27 (0.38) 0.66 (0.32) Ordinary Logistic Regression 0.57 (0.23) Treatment-0.30 (0.23) Period 0.67 (0.29) Intercept Marginal (GEE) Logistic Regression Variable 36 Comparison of Marginal and Random Effect Logistic Regressions • Regression coefficients in the random effects model are roughly 3.3 times as large

Restricted Cubic Spline Regression: A Brief Introduction
support.sas.comINTRODUCTION . We use regression analyses to learn about the relationship between a set of predictors and an outcome. Drawing valid conclusions requires properly adjusting for predictors. Many of the predictors we use are continuous variables, and it can be a challenge to model their relationship to the outcome, balancing the ...
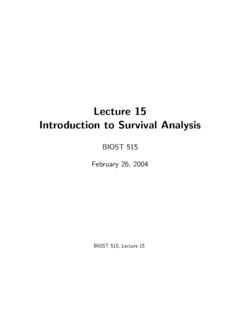
Lecture 15 Introduction to Survival Analysis
www.stat.columbia.eduIntroduction to Survival Analysis BIOST 515 February 26, 2004 BIOST 515, Lecture 15. Background In logistic regression, we were interested in studying how risk factors were associated with presence or absence of disease. Sometimes, though, we are interested in how a risk factor or treatment affects time to disease or some other event. Or we
REGRESSION WITH TIME SERIES VARIABLES - Stony Brook
www.ams.sunysb.eduINTRODUCTION •Regression modelling goal is complicated when the researcher uses time series data since an explanatory variable may influence a dependent variable with a time lag. This often necessitates the inclusion of lags of the explanatory variable in the regression. •If “time” is the unit of analysis we can still regress some dependent
CHAPTER Logistic Regression - Stanford University
www.web.stanford.educase of logistic regression first in the next few sections, and then briefly summarize the use of multinomial logistic regression for more than two classes in Section5.3. We’ll introduce the mathematics of logistic regression in the next few sections. …

Classification: Basic Concepts, Decision Trees, and Model ...
www-users.cse.umn.eduRegression techniques are covered in Appendix D. Definition 4.1 (Classification). Classification is the task of learning a tar-get function f that maps each attribute set x to one of the predefined class labels y. The target function is also known informally as a …