Example: confidence
Bayesian Inference for the Normal Distribution
Given a random sample { }from a Normal population with mean and variance 4. Please (a) Derive a sufficient statistic for . (b) Derive the maximum likelihood estimator (MLE) of . (c) Assuming the prior of Derive the the Bayes estimator of . (d) Which of the two estimators (the Bayes estimator and the MLE) ...
Tags:
Information
Domain:
Source:
Link to this page:
Documents from same domain
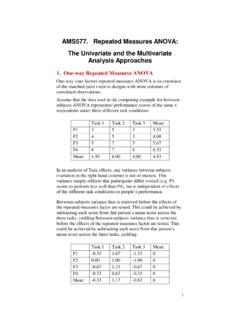
AMS577. Repeated Measures ANOVA: The …
www.ams.sunysb.edu1 AMS577. Repeated Measures ANOVA: The Univariate and the Multivariate Analysis Approaches 1. One-way Repeated Measures ANOVA One-way (one-factor) repeated-measures ANOVA is an extension
Repeated Measures ANOVA - Stony Brook
www.ams.sunysb.eduAs with any ANOVA, repeated measures ANOVA tests ... In the one-way analysis of variance without a repeated measure, we would have each subject receive
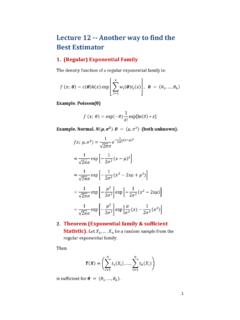
Lecture 12 -- Another way to find the Best Estimator
www.ams.sunysb.edu1 Lecture 12 -- Another way to find the Best Estimator 1. (Regular) Exponential Family The density function of a regular exponential family is:

Examples: Joint Densities and Joint Mass Functions
www.ams.sunysb.eduAMS 311 Joe Mitchell Examples: Joint Densities and Joint Mass Functions Example 1: X and Y are jointly continuous with joint pdf f(x,y) = ˆ cx2 + xy 3 if 0 ≤ x ≤ 1, 0 ≤ y ≤ 2

Chapter 3: The basic concepts of probability - Stony Brook
www.ams.sunysb.eduChapter 3: The basic concepts of probability Experiment: a measurement process that produces quantifiable results (e.g. throwing two dice, dealing cards, at poker, measuring heights of people, recording proton-proton collisions)
Vector Autoregression - Stony Brook
www.ams.sunysb.eduOverview Vector Autoregression (VAR) model is an extension of univariate autoregression model to multivariate time series data VAR model is a multi-equation system where all the variables are treated as endogenous (dependent) There is one equation for each variable as dependent variable. In its reduced form, the right-hand side of each
REGRESSION WITH TIME SERIES VARIABLES
www.ams.sunysb.edu•Regression modelling goal is complicated when the researcher uses time series data since an explanatory variable may influence a dependent variable with a time lag. This often necessitates the inclusion of lags of the explanatory variable in the regression. •If “time” is the unit of analysis we can still regress some dependent

Unit Root & Augmented Dickey-Fuller (ADF) Test
www.ams.sunysb.eduDickey-Fuller Tests • If a constant or trend belong in the equation we must also use D-F test stats that adjust for the impact on the distribution of the test statistic (* see problem set 3 where we included the drift/linear trend in the Augmented D-F test). • The D-F is generalized into the Augmented D-F test to accommodate the general

The Ordinary Least Squares (OLS) Estimator
www.ams.sunysb.eduGauss-Markov Theorem • Given OLS assumptions 1 through 6, the OLS estimator of β k is the minimum variance estimator from the set of all linear unbiased estimators of β
Related documents

General Bivariate Normal - Duke University
www2.stat.duke.eduGeneral Bivariate Normal - RNG Consequently, if we want to generate a Bivariate Normal random variable with X ˘N( X;˙2 X) and Y ˘N( Y;˙2 Y) where the correlation of X and Y is ˆwe can generate two independent unit normals Z 1 and Z 2 and use the transformation: X = ˙ XZ 1 + X Y = ˙ Y [ˆZ 1 + p 1 ˆ2Z 2] + Y

Lecture 1. Random vectors and multivariate normal …
www.stat.pitt.eduIf Xis a p 1 random vector then its distribution is uniquely determined by the distributions of linear functions of t0X, for every t 2Rp. Corollary 4 paves the way to the de nition of (general) multivariate normal distribution. De nition 2. A random vector X2Rphas a multivariate normal distribution if t0Xis an univariate normal for all t 2Rp.
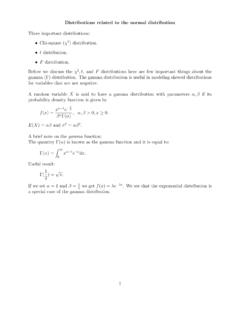
Chapter 5: Normal Probability Distributions - Solutions
websupport1.citytech.cuny.edu5.2 Normal Distributions: Finding Probabilities If you are given that a random variable Xhas a normal distribution, nding probabilities corresponds to nding the area between the standard normal curve and the x-axis, using the table of z-scores. The mean (expected value) and standard deviation ˙should be given in the problem.

Properties of the Normal and Multivariate Normal …
www.stat.ubc.caFurthermore, the random variables in Y have a joint multivariate normal distribution, denoted by MN( ; ). We will assume the distribution is not degenerate, i.e., is full rank, invertible, and hence positive definite. The vector a denotes a vector of constants, i.e., not random variables, in the following. Similarly, B is a matrix of constants. 1.
Two Proofs of the Central Limit Theorem
www.cs.toronto.edueral circumstances, if you sum independent random variables and normalize them accordingly, then at the limit (when you sum lots of them) you’ll get a normal distribution. For reference, here is the density of the normal distribution N( ;˙2) with mean and variance ˙2: 1 p 2ˇ˙2 e (x )2 2˙2: We now state a very weak form of the central ...
Distributions related to the normal distribution
www.stat.ucla.eduThe ˜2 1 (1 degree of freedom) - simulation A random sample of size n= 100 is selected from the standard normal distribution N(0;1). Here is the sample and its histogram. [1] 0.934816959 -0.839400705 -0.860137605 -1.442432294

Distributions: Uniform, Normal, Exponential
www.unf.eduII. Normal Distribution For a finite population the mean (m) and standard deviation (s) provide a measure of average value and degree of variation from the average value. If random samples of size n are drawn from the population, then it can be shown (the Central Limit Theorem) that the distribution of the sample means approximates that of a
Random Walk: A Modern Introduction
www.math.uchicago.eduRandom walk – the stochastic process formed by successive summation of independent, identically distributed random variables – is one of the most basic and well-studied topics in probability theory. For random walks on the integer lattice Zd, the main reference is the classic book by Spitzer [16].