Transcription of BERKSHIRE HATHAWAY INC.
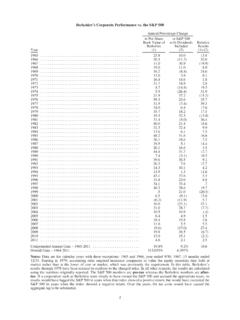
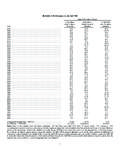
1 BERKSHIRE s Corporate Performance vs. the S&P 500 Annual Percentage ChangeYearin Per-ShareBook Value ofBerkshire(1)in S&P 500with DividendsIncluded(2)RelativeResults(1)-( 2) ( ) ( ) ( ) ( ) ( ) ( ) ( ) ( ) ( ) ( ) ( ) ( ) ( )( ) ( ) ( ) (.4) ( )( ) ( ) ( )Compounded Annual Gain Gain ,409%6,262%Notes:Data are for calendar years with these exceptions: 1965 and 1966, year ended 9/30; 1967, 15 months ended12 in 1979, accounting rules required insurance companies to value the equity securities they hold at marketrather than at the lower of cost or market, which was previously the requirement. In this table, BERKSHIRE s resultsthrough 1978 have been restated to conform to the changed rules. In all other respects, the results are calculated usingthe numbers originally S&P 500 numbers arepre-taxwhereas the BERKSHIRE numbers areafter-tax. If a corporation such as Berkshirewere simply to have owned the S&P 500 and accrued the appropriate taxes, its results would have lagged the S&P 500in years when that index showed a positive return, but would have exceeded the S&P 500 in years when the indexshowed a negative return.
2 Over the years, the tax costs would have caused the aggregate lag to be HATHAWAY the Shareholders of BERKSHIRE HATHAWAY Inc.:The per-share book value of both our Class A and Class B stock increased by 13% in 2010 . Over thelast 46 years (that is, since present management took over), book value has grown from $19 to $95,453, a rate compounded annually.*The highlight of 2010 was our acquisition of Burlington Northern Santa Fe, a purchase that s workingout even better than I expected. It now appears that owning this railroad will increase BERKSHIRE s normal earning power by nearly 40% pre-tax and by well over 30% after-tax. Making this purchase increased our sharecount by 6% and used $22 billion of cash. Since we ve quickly replenished the cash, the economics of thistransaction have turned out very normal year, of course, is not something that either Charlie Munger, Vice Chairman of Berkshireand my partner, or I can define with anything like precision.
3 But for the purpose of estimating our current earningpower, we are envisioning a year free of a mega-catastrophe in insurance and possessing a general businessclimate somewhat better than that of 2010 but weaker than that of 2005 or 2006. Using these assumptions, andseveral others that I will explain in the Investment section, I can estimate that the normal earning power of theassets we currently own is about $17 billion pre-tax and $12 billion after-tax, excluding any capital gains orlosses. Every day Charlie and I think about how we can build on this of us are enthusiastic about BNSF s future because railroads have major cost and environmentaladvantages over trucking, their main competitor. Last year BNSF moved each ton of freight it carried a record500 miles on a single gallon of diesel fuel. That sthreetimes more fuel-efficient than trucking is, which meansour railroad owns an important advantage in operating costs.
4 Concurrently, our country gains because of reducedgreenhouse emissions and a much smaller need for imported oil. When traffic travels by rail, society time, the movement of goods in the United States will increase, and BNSF should get its fullshare of the gain. The railroad will need to invest massively to bring about this growth, but no one is bettersituated than BERKSHIRE to supply the funds required. However slow the economy, or chaotic the markets, ourchecks will year in the face of widespread pessimism about our economy we demonstrated our enthusiasmfor capital investment at BERKSHIRE by spending $6 billion on property and equipment. Of this amount,$ billion or 90% of the total was spent in the United States. Certainly our businesses will expand abroad inthe future, but an overwhelming part of their future investments will be at home. In 2011, we will set a newrecord for capital spending $8 billion and spendallof the $2 billion increase in the United will always flow toward opportunity, and there is an abundance of that in today often talk of great uncertainty.
5 But think back, for example, to December 6,1941, October 18, 1987 and September 10, 2001. No matter how serene today may be, tomorrow isalwaysuncertain.* All per-share figures used in this report apply to BERKSHIRE s A shares. Figures for the B shares are1/1500thof those shown for t let that reality spook you. Throughout my lifetime, politicians and pundits have constantlymoaned about terrifying problems facing America. Yet our citizens now live an astonishing six times better thanwhen I was born. The prophets of doom have overlooked the all-important factor thatiscertain: Human potentialis far from exhausted, and the American system for unleashing that potential a system that has worked wondersfor over two centuries despite frequent interruptions for recessions and even a Civil War remains alive are not natively smarter than we were when our country was founded nor do we work harder. Butlook around you and see a world beyond the dreams of any colonial citizen.
6 Now, as in 1776, 1861, 1932 and1941, America s best days lie and I believe that those entrusted with handling the funds of others should establishperformance goals at the onset of their stewardship. Lacking such standards, managements are tempted to shootthe arrow of performance and then paint the bull s-eye around wherever it BERKSHIRE s case, we long ago told you that our job is to increase per-share intrinsic value at a rategreater than the increase (including dividends) of the S&P 500. In some years we succeed; in others we fail. But,if we are unable over time to reach that goal, we have done nothing for our investors, who by themselves couldhave realized an equal or better result by owning an index challenge, of course, is the calculation of intrinsic value. Present that task to Charlie and meseparately, and you will get two different answers. Precision just isn t eliminate subjectivity, we therefore use anunderstatedproxy for intrinsic-value book value when measuring our performance.
7 To be sure, some of our businesses are worth far more than their carryingvalue on our books. (Later in this report, we ll present a case study.) But since that premium seldom swingswildly from year to year, book value can serve as a reasonable device for tracking how we are table on page 2 shows our 46-year record against the S&P, a performance quite good in the earlieryears and now only satisfactory. The bountiful years, we want to emphasize, will never return. The huge sums ofcapital we currently manage eliminateanychance of exceptional performance. We will strive, however, forbetter-than-average results and feel it fair for you to hold us to that figures, it should be noted, are neither to be ignored nor viewed as all-important. The pace ofthe earth s movement around the sun is not synchronized with the time required for either investment ideas oroperating decisions to bear fruit. At GEICO, for example, we enthusiastically spent $900 million last year onadvertising to obtain policyholders who deliver us no immediate profits.
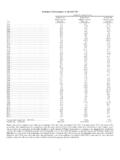
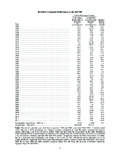
8 If we could spend twice that amountproductively, we would happily do so though short-term results would be further penalized. Many largeinvestments at our railroad and utility operations are also made with an eye to payoffs well down the provide you a longer-term perspective on performance, we present on the facing page the yearlyfigures from page 2 recast into a series of five-year periods. Overall, there are 42 of these periods, and they tellan interesting story. On a comparative basis, our best years ended in the early 1980s. Themarket sgolden period,however, came in the 17 following years, with BERKSHIRE achieving stellar absolute returns even as our relativeadvantage 1999, the market stalled (or have you already noticed that?). Consequently, the satisfactoryperformance relative to the S&P that BERKSHIRE has achieved since then has delivered only moderate forward, we hope to average several points better than the S&P though that result is, ofcourse, far from a sure thing.
9 If we succeed in that aim, we will almost certainly produce better relative results inbad years for the stock market and suffer poorer results in strong s Corporate Performance vs. the S&P 500 by Five-Year PeriodsAnnual Percentage ChangeFive-Year Periodin Per-ShareBook Value ofBerkshire(1)in S&P 500with DividendsIncluded(2)RelativeResults(1)-( 2) ( ) ( ) ( ) ( ) ( ) ( ) :The first two periods cover the five years beginning September 30 of the previous year. The third period covers63 months beginning September 30, 1966 to December 31, 1971. All other periods involve calendar other notes on page 2 also apply to this Value Today and TomorrowThough BERKSHIRE s intrinsic value cannot be precisely calculated, two of its three key pillars can bemeasured. Charlie and I rely heavily on these measurements when we make our own estimates of BERKSHIRE first component of value is our investments: stocks, bonds and cash equivalents.
10 At yearend thesetotaled $158 billion at market float money we temporarily hold in our insurance operations that does not belong to us funds $66 billion of our investments. This float is free as long as insurance underwriting breaks even, meaningthat the premiums we receive equal the losses and expenses we incur. Of course, underwriting results are volatile,swinging erratically between profits and losses. Over our entire history, though, we ve been significantlyprofitable, and I also expect us to average breakeven results or better in the future. If we do that, all of ourinvestments those funded both by float and by retained earnings can be viewed as an element of value forBerkshire s second component of value is earnings that come from sources other than investments andinsurance underwriting. These earnings are delivered by our 68 non-insurance companies, itemized on page BERKSHIRE s early years, we focused on the investment side.